Git Jobs in Surrey

Git Distributed Version Control System
South East > Surrey

The table below provides summary statistics for permanent job vacancies advertised in Surrey requiring Git skills. It includes a benchmarking guide to the annual salaries offered in vacancies that cited Git over the 6 months leading up to 6 October 2024, comparing them to the same period in the previous two years.

6 months to
6 Oct 2024
Same period 2023 Same period 2022
Rank 57 70 49
Rank change year-on-year +13 -21 -2
Permanent jobs citing Git 77 30 211
As % of all permanent jobs advertised in Surrey 4.17% 2.69% 6.35%
As % of the Development Applications category 37.38% 30.61% 31.73%
Number of salaries quoted 55 25 93
10th Percentile - £32,500 £41,500
25th Percentile £40,000 £47,500 £48,000
Median annual salary (50th Percentile) £55,000 £55,000 £55,000
75th Percentile £76,875 £62,500 £90,000
90th Percentile £82,500 £72,000 £107,500
South East median annual salary £60,000 £65,000 £60,000
% change year-on-year -7.69% +8.33% +20.00%

All Development Application Skills
Surrey

Git falls under the Development Applications category. For comparison with the information above, the following table provides summary statistics for all permanent job vacancies requiring development application skills in Surrey.

Permanent vacancies with a requirement for development application skills 206 98 665
As % of all permanent jobs advertised in Surrey 11.17% 8.79% 20.00%
Number of salaries quoted 119 66 421
10th Percentile £40,000 £32,500 £37,500
25th Percentile £46,250 £45,625 £47,500
Median annual salary (50th Percentile) £60,000 £55,000 £60,000
Median % change year-on-year +9.09% -8.33% +2.13%
75th Percentile £73,750 £64,688 £73,750
90th Percentile £82,500 £93,875 £85,000
South East median annual salary £60,000 £60,000 £57,500
% change year-on-year - +4.35% +9.52%

Git
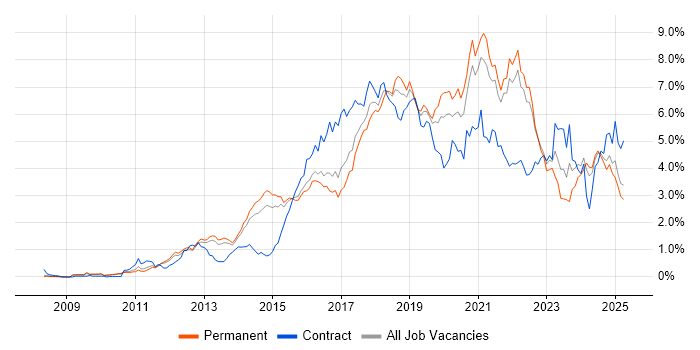
Job Vacancy Trend in Surrey

Job postings citing Git as a proportion of all IT jobs advertised in Surrey.

Job vacancy trend for Git in Surrey

Git
Salary Trend in Surrey

3-month moving average salary quoted in jobs citing Git in Surrey.

Salary trend for Git in Surrey

Git
Salary Histogram in Surrey

Salary distribution for jobs citing Git in Surrey over the 6 months to 6 October 2024.

Salary histogram for Git in Surrey

Git
Job Locations in Surrey

The table below looks at the demand and provides a guide to the median salaries quoted in IT jobs citing Git within the Surrey region over the 6 months to 6 October 2024. The 'Rank Change' column provides an indication of the change in demand within each location based on the same 6 month period last year.

Location Rank Change
on Same Period
Last Year
Matching
Permanent
IT Job Ads
Median Salary
Past 6 Months
Median Salary
% Change
on Same Period
Last Year
Live
Jobs
Woking -7 18 £45,000 +28.57% 2
Leatherhead +16 10 - - 1
Guildford +1 6 £63,750 -15.00% 3
Weybridge +4 5 £80,000 -
Redhill +3 5 £52,500 +90.91% 1
Camberley +1 5 £80,000 +23.08%
Egham -5 4 £67,500 +50.00%
Tadworth -10 3 £47,500 -
Staines - 3 £57,500 - 1
Godalming - 2 - -
Reigate - 1 £85,000 -
Sunbury-on-Thames - 1 £87,500 -
Git
South East

Git
Co-occurring Skills and Capabilities in Surrey by Category

The follow tables expand on the table above by listing co-occurrences grouped by category. The same employment type, locality and period is covered with up to 20 co-occurrences shown in each of the following categories:

Application Platforms
1 5 (6.49%) IIS
1 5 (6.49%) nginx
2 2 (2.60%) Confluence
2 2 (2.60%) SharePoint
Applications
1 18 (23.38%) Simulink
2 2 (2.60%) MS Visio
Business Applications
1 1 (1.30%) Sparx Enterprise Architect
Cloud Services
1 50 (64.94%) Azure
2 26 (33.77%) AWS
3 24 (31.17%) Azure DevOps
4 17 (22.08%) Azure Service Bus
5 15 (19.48%) Azure Cosmos DB
6 10 (12.99%) SonarCloud
7 6 (7.79%) GitHub
8 5 (6.49%) Azure AKS
8 5 (6.49%) Azure Monitor
8 5 (6.49%) Azure Pipelines
8 5 (6.49%) Cloudflare
9 3 (3.90%) GCP
10 2 (2.60%) Microsoft 365
10 2 (2.60%) Miro
11 1 (1.30%) Figma
11 1 (1.30%) NuGet
11 1 (1.30%) OpenShift
11 1 (1.30%) Pulumi
11 1 (1.30%) Serverless
11 1 (1.30%) Twilio
Communications & Networking
1 2 (2.60%) DHCP
1 2 (2.60%) DNS
1 2 (2.60%) Firewall
1 2 (2.60%) LAN
1 2 (2.60%) SSH
1 2 (2.60%) WAN
1 2 (2.60%) Wi-Fi
2 1 (1.30%) Internet
2 1 (1.30%) MQTT
Database & Business Intelligence
1 24 (31.17%) NoSQL
2 11 (14.29%) Elasticsearch
3 7 (9.09%) SQL Server
4 5 (6.49%) Azure SQL Database
5 4 (5.19%) PostgreSQL
6 2 (2.60%) Big Data
7 1 (1.30%) MongoDB
7 1 (1.30%) Redis
7 1 (1.30%) SQLite
Development Applications
1 19 (24.68%) Vagrant
2 15 (19.48%) Octopus Deploy
2 15 (19.48%) Visual Studio
3 12 (15.58%) Jenkins
3 12 (15.58%) Team Foundation Server
4 11 (14.29%) MSBuild
5 10 (12.99%) Subversion
6 8 (10.39%) JIRA
7 6 (7.79%) Artifactory
7 6 (7.79%) Selenium
7 6 (7.79%) SonarQube
8 5 (6.49%) GitLab
9 3 (3.90%) Maven
10 2 (2.60%) Axure RP
10 2 (2.60%) CMake
10 2 (2.60%) TestRail
11 1 (1.30%) rollup.js
11 1 (1.30%) TeamCity
11 1 (1.30%) Visual Studio Team System
General
1 18 (23.38%) Social Skills
2 16 (20.78%) Finance
3 11 (14.29%) Aerospace
3 11 (14.29%) Analytical Skills
4 6 (7.79%) Retail
5 5 (6.49%) Public Sector
6 4 (5.19%) Electronics
6 4 (5.19%) Manufacturing
6 4 (5.19%) Marketing
6 4 (5.19%) Telecoms
7 2 (2.60%) Organisational Skills
8 1 (1.30%) Inclusion and Diversity
8 1 (1.30%) Military
8 1 (1.30%) Presentation Skills
Job Titles
1 29 (37.66%) Software Engineer
2 18 (23.38%) SC Cleared Software Engineer
3 15 (19.48%) Senior
4 14 (18.18%) Developer
5 13 (16.88%) DevOps Engineer
6 11 (14.29%) Architect
6 11 (14.29%) Azure DevOps Engineer
6 11 (14.29%) Azure Engineer
7 10 (12.99%) Technical Architect
8 7 (9.09%) Java Developer
8 7 (9.09%) Senior DevOps
8 7 (9.09%) Senior DevOps Engineer
9 6 (7.79%) Configuration Manager
10 5 (6.49%) Senior Software Engineer
11 2 (2.60%) Administrator
11 2 (2.60%) C# Software Engineer
11 2 (2.60%) Junior
11 2 (2.60%) Junior Developer
11 2 (2.60%) Senior C# Software Engineer
11 2 (2.60%) Software Developer
Libraries, Frameworks & Software Standards
1 24 (31.17%) .NET
2 23 (29.87%) HTML
3 20 (25.97%) CSS
4 19 (24.68%) Middleware
5 18 (23.38%) REST
6 13 (16.88%) XML
7 12 (15.58%) ASP.NET
7 12 (15.58%) JSON
7 12 (15.58%) Twitter Bootstrap
8 10 (12.99%) gRPC
9 9 (11.69%) React
10 7 (9.09%) AngularJS
11 6 (7.79%) RabbitMQ
12 5 (6.49%) ARM Templates
12 5 (6.49%) Loki
13 4 (5.19%) SOAP
13 4 (5.19%) Spring
13 4 (5.19%) Spring Boot
13 4 (5.19%) Web Services
14 3 (3.90%) WPF
Miscellaneous
1 3 (3.90%) FPGA
2 2 (2.60%) CUDA
2 2 (2.60%) Social Media
3 1 (1.30%) Client/Server
3 1 (1.30%) Cloud Native
3 1 (1.30%) IoT
3 1 (1.30%) Onboarding
3 1 (1.30%) Product Ownership
3 1 (1.30%) Self-Motivation
3 1 (1.30%) Verilog
3 1 (1.30%) VHDL
Operating Systems
1 27 (35.06%) Linux
2 21 (27.27%) Ubuntu
3 19 (24.68%) Android
3 19 (24.68%) CentOS
3 19 (24.68%) Red Hat Enterprise Linux
4 7 (9.09%) Windows
5 2 (2.60%) Windows Server
Processes & Methodologies
1 38 (49.35%) Software Engineering
2 37 (48.05%) DevOps
3 35 (45.45%) Microservices
4 29 (37.66%) Collaborative Working
5 27 (35.06%) Agile
6 25 (32.47%) Computer Science
7 22 (28.57%) Problem-Solving
8 21 (27.27%) Artificial Intelligence
9 20 (25.97%) Infrastructure as Code
9 20 (25.97%) Machine Learning
10 19 (24.68%) Signal Processing
11 15 (19.48%) Code Quality
12 14 (18.18%) Mentoring
12 14 (18.18%) MVC
13 11 (14.29%) Design Patterns
14 10 (12.99%) API Integration
14 10 (12.99%) Data Encryption
14 10 (12.99%) Event-Driven
14 10 (12.99%) Event-Driven Architecture
14 10 (12.99%) Performance Testing
Programming Languages
1 43 (55.84%) JavaScript
2 38 (49.35%) SQL
3 35 (45.45%) Python
4 27 (35.06%) C++
4 27 (35.06%) Java
5 26 (33.77%) C#
6 21 (27.27%) PowerShell
7 19 (24.68%) Kotlin
8 8 (10.39%) Bash
8 8 (10.39%) C
9 5 (6.49%) Bicep
10 4 (5.19%) TypeScript
11 2 (2.60%) C-shell
11 2 (2.60%) Fortran
11 2 (2.60%) Rust
12 1 (1.30%) MATLAB
12 1 (1.30%) T-SQL
Qualifications
1 32 (41.56%) Degree
2 25 (32.47%) Computer Science Degree
3 24 (31.17%) SC Cleared
3 24 (31.17%) Security Cleared
4 1 (1.30%) Master's Degree
4 1 (1.30%) PhD
Quality Assurance & Compliance
1 10 (12.99%) GDPR
2 6 (7.79%) Solvency II
3 3 (3.90%) QA
4 2 (2.60%) Accessibility
System Software
1 19 (24.68%) Docker
2 6 (7.79%) Virtual Machines
3 3 (3.90%) Firmware
4 2 (2.60%) Active Directory
4 2 (2.60%) NFS
4 2 (2.60%) Samba
5 1 (1.30%) Embedded Firmware
5 1 (1.30%) VMware Infrastructure
Systems Management
1 32 (41.56%) Ansible
2 29 (37.66%) Terraform
3 7 (9.09%) Kubernetes
4 5 (6.49%) Grafana
4 5 (6.49%) Prometheus
5 2 (2.60%) ZABBIX
6 1 (1.30%) Podman
6 1 (1.30%) Puppet
Vendors
1 18 (23.38%) Xilinx
2 6 (7.79%) Veracode
3 4 (5.19%) SAP
4 3 (3.90%) Google
4 3 (3.90%) Microsoft
5 2 (2.60%) Red Hat
6 1 (1.30%) EMC
6 1 (1.30%) Oracle
6 1 (1.30%) Sparx
6 1 (1.30%) VMware