Windows Jobs in Surrey

Microsoft Windows
South East > Surrey

The table below provides summary statistics for permanent job vacancies advertised in Surrey requiring Windows skills. It includes a benchmarking guide to the annual salaries offered in vacancies that cited Windows over the 6 months leading up to 8 September 2024, comparing them to the same period in the previous two years.

6 months to
8 Sep 2024
Same period 2023 Same period 2022
Rank 20 9 24
Rank change year-on-year -11 +15 -13
Permanent jobs citing Windows 188 165 377
As % of all permanent jobs advertised in Surrey 9.79% 13.52% 10.42%
As % of the Operating Systems category 54.34% 67.07% 58.09%
Number of salaries quoted 115 116 304
10th Percentile £26,850 £28,000 £26,075
25th Percentile £31,250 £30,500 £29,938
Median annual salary (50th Percentile) £45,000 £36,800 £38,250
Median % change year-on-year +22.28% -3.79% -5.56%
75th Percentile £58,750 £58,750 £55,000
90th Percentile £65,000 £67,500 £73,750
South East median annual salary £45,000 £41,250 £42,500
% change year-on-year +9.09% -2.94% +1.19%

All Operating Systems
Surrey

Windows falls under the Operating Systems category. For comparison with the information above, the following table provides summary statistics for all permanent job vacancies requiring operating system skills in Surrey.

Permanent vacancies with a requirement for operating system skills 346 246 649
As % of all permanent jobs advertised in Surrey 18.01% 20.16% 17.93%
Number of salaries quoted 193 181 445
10th Percentile £28,350 £28,250 £27,000
25th Percentile £35,000 £31,500 £31,250
Median annual salary (50th Percentile) £50,000 £45,000 £42,500
Median % change year-on-year +11.11% +5.88% -10.53%
75th Percentile £63,750 £60,000 £55,000
90th Percentile £85,000 £68,750 £70,000
South East median annual salary £50,000 £46,000 £45,000
% change year-on-year +8.70% +2.22% -5.26%

Windows
Job Vacancy Trend in Surrey

Job postings citing Windows as a proportion of all IT jobs advertised in Surrey.
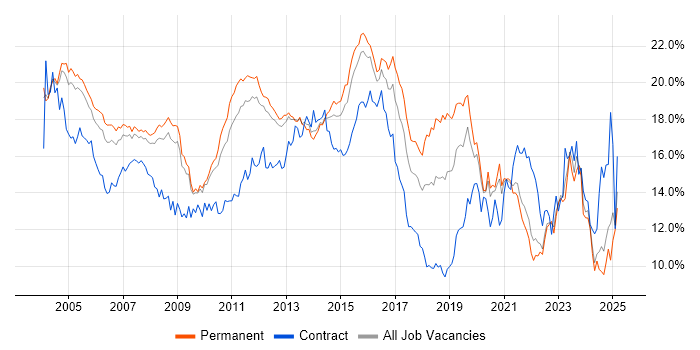
Job vacancy trend for Windows in Surrey

Windows
Salary Trend in Surrey

3-month moving average salary quoted in jobs citing Windows in Surrey.

Salary trend for Windows in Surrey

Windows
Salary Histogram in Surrey

Salary distribution for jobs citing Windows in Surrey over the 6 months to 8 September 2024.

Salary histogram for Windows in Surrey

Windows
Job Locations in Surrey

The table below looks at the demand and provides a guide to the median salaries quoted in IT jobs citing Windows within the Surrey region over the 6 months to 8 September 2024. The 'Rank Change' column provides an indication of the change in demand within each location based on the same 6 month period last year.

Location Rank Change
on Same Period
Last Year
Matching
Permanent
IT Job Ads
Median Salary
Past 6 Months
Median Salary
% Change
on Same Period
Last Year
Live
Jobs
Redhill +9 36 £35,000 -41.67% 6
Guildford +7 28 £32,500 +3.17% 4
Leatherhead +5 23 £43,065 +0.15% 2
Addlestone -8 11 - -
Camberley -2 10 £50,000 +11.11% 4
Epsom -2 8 £57,500 +130.00% 1
Reigate +9 6 £26,000 -71.11% 1
Weybridge +4 6 £31,500 -41.12%
Egham -2 5 £67,500 +80.00% 1
Woking -28 4 £26,500 -53.91% 1
Dorking - 4 £32,000 -
Horley - 3 - -
Godalming -2 2 £55,000 -15.38% 1
Windlesham - 2 £28,500 -
Staines -8 1 £45,000 -37.93%
Chertsey -8 1 £60,000 +71.43% 1
Sunbury-on-Thames -9 1 - -
Windows
South East

Windows
Co-occurring Skills and Capabilities in Surrey by Category

The follow tables expand on the table above by listing co-occurrences grouped by category. The same employment type, locality and period is covered with up to 20 co-occurrences shown in each of the following categories:

Application Platforms
1 35 (18.62%) Microsoft Exchange
2 16 (8.51%) SharePoint
3 6 (3.19%) IIS
4 5 (2.66%) nginx
5 4 (2.13%) Confluence
6 2 (1.06%) Mule
6 2 (1.06%) TWiki
7 1 (0.53%) Apache
Applications
1 16 (8.51%) Microsoft Excel
2 15 (7.98%) Microsoft PowerPoint
3 10 (5.32%) Microsoft Office
Business Applications
1 1 (0.53%) assyst
Cloud Services
1 53 (28.19%) Azure
1 53 (28.19%) Microsoft 365
2 16 (8.51%) AWS
3 11 (5.85%) Azure DevOps
3 11 (5.85%) Veeva
4 9 (4.79%) Cloudflare
4 9 (4.79%) IaaS
4 9 (4.79%) Nutanix
5 7 (3.72%) Cloud Computing
6 6 (3.19%) Azure Service Bus
6 6 (3.19%) Twilio
7 5 (2.66%) Azure AKS
7 5 (2.66%) Azure Cosmos DB
7 5 (2.66%) Azure Monitor
7 5 (2.66%) Azure Pipelines
8 4 (2.13%) Google Workspace
8 4 (2.13%) Mimecast
8 4 (2.13%) SaaS
9 3 (1.60%) Amazon EC2
9 3 (1.60%) Amazon S3
Communications & Networking
1 35 (18.62%) Firewall
2 21 (11.17%) DNS
3 17 (9.04%) VPN
4 15 (7.98%) SAN
5 13 (6.91%) NAS
6 12 (6.38%) DHCP
6 12 (6.38%) Wireless
7 11 (5.85%) Wi-Fi
8 10 (5.32%) SNMP
9 8 (4.26%) LAN
9 8 (4.26%) WAN
10 7 (3.72%) Network Security
10 7 (3.72%) TCP/IP
11 6 (3.19%) Remote Desktop
11 6 (3.19%) VoIP
12 4 (2.13%) BGP
12 4 (2.13%) iSCSI
12 4 (2.13%) NetScaler
12 4 (2.13%) OSPF
12 4 (2.13%) RIP
Database & Business Intelligence
1 30 (15.96%) SQL Server
2 5 (2.66%) Azure SQL Database
3 4 (2.13%) MariaDB
3 4 (2.13%) MySQL
4 2 (1.06%) Oracle Database
5 1 (0.53%) MongoDB
Development Applications
1 9 (4.79%) Git
2 7 (3.72%) eggPlant
2 7 (3.72%) JIRA
3 5 (2.66%) Octopus Deploy
4 4 (2.13%) Jenkins
5 2 (1.06%) Ant
5 2 (1.06%) Atlassian Bamboo
5 2 (1.06%) Bitbucket
5 2 (1.06%) Oracle Forms
5 2 (1.06%) Subversion
5 2 (1.06%) Trac
5 2 (1.06%) Visual Studio
6 1 (0.53%) Cypress.io
6 1 (0.53%) JMeter
6 1 (0.53%) Postman
6 1 (0.53%) Selenium
6 1 (0.53%) SoapUI
General
1 43 (22.87%) Social Skills
2 23 (12.23%) Analytical Skills
2 23 (12.23%) Finance
3 17 (9.04%) Law
4 15 (7.98%) Telecoms
5 11 (5.85%) Pharmaceutical
6 9 (4.79%) Aerospace
7 6 (3.19%) Retail
8 5 (2.66%) Marketing
9 4 (2.13%) Back Office
9 4 (2.13%) Banking
9 4 (2.13%) Organisational Skills
9 4 (2.13%) Presentation Skills
10 3 (1.60%) Electronics
10 3 (1.60%) Legal
10 3 (1.60%) Manufacturing
11 2 (1.06%) Automotive
11 2 (1.06%) Documentation Skills
12 1 (0.53%) Inclusion and Diversity
12 1 (0.53%) Tech for Good
Job Titles
1 38 (20.21%) Analyst
2 35 (18.62%) Infrastructure Engineer
3 34 (18.09%) IT Support
4 26 (13.83%) Support Analyst
5 25 (13.30%) Senior
5 25 (13.30%) Support Engineer
6 21 (11.17%) IT Analyst
6 21 (11.17%) IT Engineer
6 21 (11.17%) IT Support Analyst
7 16 (8.51%) IT Infrastructure Engineer
8 11 (5.85%) Analytics Manager
8 11 (5.85%) IT Support Engineer
8 11 (5.85%) Senior Infrastructure Engineer
9 10 (5.32%) Service Analyst
9 10 (5.32%) Service Desk Analyst
9 10 (5.32%) Software Engineer
10 9 (4.79%) 2nd Line Support
10 9 (4.79%) 3rd Line Support
10 9 (4.79%) Azure Engineer
10 9 (4.79%) Infrastructure Support
Libraries, Frameworks & Software Standards
1 8 (4.26%) .NET
1 8 (4.26%) Hibernate
2 5 (2.66%) ARM Templates
2 5 (2.66%) RabbitMQ
3 4 (2.13%) Loki
4 3 (1.60%) WPF
5 2 (1.06%) AngularJS
6 1 (0.53%) .NET Core
6 1 (0.53%) .NET Framework
6 1 (0.53%) Apache NiFi
6 1 (0.53%) ASP.NET MVC
6 1 (0.53%) ASP.NET Web API
6 1 (0.53%) Blazor
6 1 (0.53%) Middleware
6 1 (0.53%) React
6 1 (0.53%) REST
6 1 (0.53%) Svelte
6 1 (0.53%) Vue
6 1 (0.53%) WCF
6 1 (0.53%) WinForms
Miscellaneous
1 21 (11.17%) Self-Motivation
2 17 (9.04%) Blackberry
3 16 (8.51%) Management Information System
4 13 (6.91%) Clustering
4 13 (6.91%) IoT
5 8 (4.26%) Driving Licence
6 7 (3.72%) Video Conferencing
7 6 (3.19%) Onboarding
8 4 (2.13%) NHS
8 4 (2.13%) Smartphone
9 3 (1.60%) Client/Server
9 3 (1.60%) Digital Signage
9 3 (1.60%) EMC VMAX
9 3 (1.60%) Operational Technology
9 3 (1.60%) Replication
9 3 (1.60%) SCADA
10 2 (1.06%) FPGA
10 2 (1.06%) Low-Code
10 2 (1.06%) Renewable Energy
11 1 (0.53%) CCTV
Operating Systems
1 46 (24.47%) Windows Server
2 45 (23.94%) Linux
3 40 (21.28%) Windows 10
4 9 (4.79%) Windows Server 2008
5 8 (4.26%) Windows Server 2019
6 7 (3.72%) Apple iOS
6 7 (3.72%) Ubuntu
7 6 (3.19%) Android
8 5 (2.66%) Unix
9 4 (2.13%) Debian
9 4 (2.13%) Mac OS
10 2 (1.06%) Red Hat Enterprise Linux
10 2 (1.06%) Windows 7
Processes & Methodologies
1 55 (29.26%) Problem-Solving
2 41 (21.81%) Infrastructure Engineering
3 32 (17.02%) ITIL
4 26 (13.83%) Kalman Filter
5 25 (13.30%) Computer Science
6 24 (12.77%) Disaster Recovery
7 23 (12.23%) DevOps
8 20 (10.64%) Cybersecurity
8 20 (10.64%) Virtual Environments
9 18 (9.57%) Change Control
9 18 (9.57%) Incident Management
9 18 (9.57%) Mobile Device Management
10 17 (9.04%) Project Management
10 17 (9.04%) Web Filtering
11 16 (8.51%) Analytics
11 16 (8.51%) Customer Service
12 13 (6.91%) High Availability
13 12 (6.38%) Capacity Planning
14 11 (5.85%) Mentoring
14 11 (5.85%) Patch Management
Programming Languages
1 33 (17.55%) PowerShell
2 22 (11.70%) SQL
3 17 (9.04%) Python
4 14 (7.45%) Java
5 12 (6.38%) Perl
6 9 (4.79%) Bash
6 9 (4.79%) C#
7 7 (3.72%) C++
8 5 (2.66%) Bicep
9 3 (1.60%) Scala
10 2 (1.06%) C
10 2 (1.06%) JavaScript
10 2 (1.06%) PL/SQL
10 2 (1.06%) T-SQL
10 2 (1.06%) VB
11 1 (0.53%) Go
11 1 (0.53%) R
Qualifications
1 49 (26.06%) Degree
2 37 (19.68%) Security Cleared
3 31 (16.49%) Microsoft Certification
3 31 (16.49%) SC Cleared
4 18 (9.57%) DV Cleared
5 17 (9.04%) HND
6 8 (4.26%) Computer Science Degree
7 7 (3.72%) MCP
8 6 (3.19%) MCSA
9 5 (2.66%) Azure Certification
10 4 (2.13%) CISSP
10 4 (2.13%) CompTIA Security+
11 3 (1.60%) ITIL Certification
12 2 (1.06%) A+ Certification
12 2 (1.06%) Numerate Degree
13 1 (0.53%) ISTQB
13 1 (0.53%) ISTQB Foundation Certification
13 1 (0.53%) Master's Degree
Quality Assurance & Compliance
1 11 (5.85%) QA
2 9 (4.79%) Data Quality
3 6 (3.19%) GDPR
3 6 (3.19%) SLA
4 1 (0.53%) Cyber Essentials
4 1 (0.53%) PMO
System Software
1 64 (34.04%) Active Directory
2 50 (26.60%) VMware Infrastructure
3 19 (10.11%) Hyper-V
4 18 (9.57%) Virtual Machines
5 13 (6.91%) Docker
6 8 (4.26%) NFS
7 6 (3.19%) pfSense
7 6 (3.19%) Virtual Desktop
8 4 (2.13%) Firmware
8 4 (2.13%) vSphere
9 3 (1.60%) VMware ESXi
10 2 (1.06%) Samba
10 2 (1.06%) Virtual Servers
10 2 (1.06%) VMware NSX
11 1 (0.53%) Microsoft Virtual Server
Systems Management
1 11 (5.85%) Kubernetes
2 10 (5.32%) Microsoft Intune
3 9 (4.79%) SCCM
4 7 (3.72%) Grafana
5 5 (2.66%) Prometheus
5 5 (2.66%) Terraform
6 4 (2.13%) Ansible
6 4 (2.13%) ZABBIX
7 3 (1.60%) NetBackup
8 2 (1.06%) Microsoft Data Protection Manager
8 2 (1.06%) Packer
8 2 (1.06%) SCDPM
8 2 (1.06%) vCenter Server
Vendors
1 109 (57.98%) Microsoft
2 56 (29.79%) VMware
3 36 (19.15%) Cisco
4 24 (12.77%) Veeam
5 19 (10.11%) McAfee
6 12 (6.38%) Dell
7 8 (4.26%) Citrix
7 8 (4.26%) NetApp
8 7 (3.72%) HP
8 7 (3.72%) Mitel
9 4 (2.13%) Aruba
9 4 (2.13%) CheckPoint
9 4 (2.13%) Google
9 4 (2.13%) QNAP
9 4 (2.13%) ServiceNow
9 4 (2.13%) Synology
9 4 (2.13%) Ubiquiti
10 3 (1.60%) Adobe
10 3 (1.60%) CyberArk
10 3 (1.60%) Isilon