Git Jobs in the South East

Git Distributed Version Control System
England > South East

The table below provides summary statistics for permanent job vacancies advertised in the South East requiring Git skills. It includes a benchmarking guide to the annual salaries offered in vacancies that cited Git over the 6 months leading up to 26 July 2024, comparing them to the same period in the previous two years.

6 months to
26 Jul 2024
Same period 2023 Same period 2022
Rank 51 34 31
Rank change year-on-year -17 -3 -2
Permanent jobs citing Git 577 768 1,830
As % of all permanent jobs advertised in the South East 3.82% 6.63% 8.29%
As % of the Development Applications category 45.25% 47.09% 41.16%
Number of salaries quoted 465 551 815
10th Percentile £40,000 £42,500 £37,500
25th Percentile £47,500 £52,500 £45,000
Median annual salary (50th Percentile) £60,000 £65,000 £57,500
Median % change year-on-year -7.69% +13.04% +9.52%
75th Percentile £73,750 £77,500 £72,500
90th Percentile £87,500 £95,000 £81,250
England median annual salary £58,000 £65,000 £62,500
% change year-on-year -10.77% +4.00% +13.64%

All Development Application Skills
South East

Git falls under the Development Applications category. For comparison with the information above, the following table provides summary statistics for all permanent job vacancies requiring development application skills in the South East.

Permanent vacancies with a requirement for development application skills 1,275 1,631 4,446
As % of all permanent jobs advertised in the South East 8.45% 14.07% 20.15%
Number of salaries quoted 921 1,120 2,398
10th Percentile £38,500 £39,149 £36,250
25th Percentile £46,250 £48,563 £45,000
Median annual salary (50th Percentile) £57,500 £60,000 £57,500
Median % change year-on-year -4.17% +4.35% +9.52%
75th Percentile £72,500 £75,000 £72,500
90th Percentile £83,750 £91,375 £84,125
England median annual salary £60,000 £65,000 £62,500
% change year-on-year -7.69% +4.00% +8.70%

Git
Job Vacancy Trend in the South East

Job postings citing Git as a proportion of all IT jobs advertised in the South East.
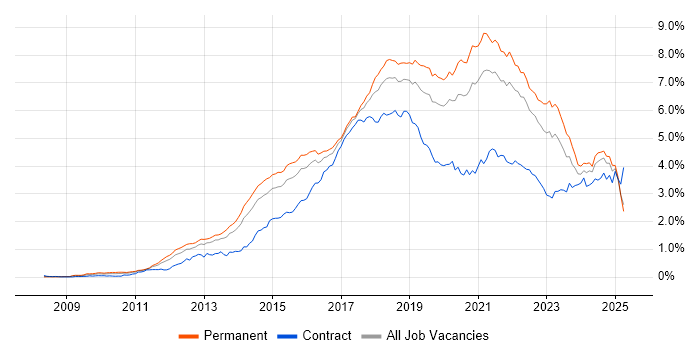
Job vacancy trend for Git in the South East

Git
Salary Trend in the South East

3-month moving average salary quoted in jobs citing Git in the South East.

Salary trend for Git in the South East

Git
Salary Histogram in the South East

Salary distribution for jobs citing Git in the South East over the 6 months to 26 July 2024.

Salary histogram for Git in the South East

Git
Job Locations in the South East

The table below looks at the demand and provides a guide to the median salaries quoted in IT jobs citing Git within the South East region over the 6 months to 26 July 2024. The 'Rank Change' column provides an indication of the change in demand within each location based on the same 6 month period last year.

Location Rank Change
on Same Period
Last Year
Matching
Permanent
IT Job Ads
Median Salary
Past 6 Months
Median Salary
% Change
on Same Period
Last Year
Live
Jobs
Thames Valley -40 166 £70,000 - 20
Hampshire -22 161 £60,000 -4.00% 19
Berkshire -29 117 £75,000 -6.25% 9
Surrey +32 115 £55,000 - 4
East Sussex +8 43 £52,500 -11.02% 4
Kent -22 41 £60,000 +4.35% 10
West Sussex +11 34 £57,500 -11.18% 5
Buckinghamshire -19 27 £54,000 -15.63% 5
Oxfordshire -41 22 £60,000 -11.11% 6
Middlesex -24 5 - -
Sussex - 4 £37,500 - 2
Git
England

Git
Co-occurring Skills and Capabilities in the South East by Category

The follow tables expand on the table above by listing co-occurrences grouped by category. The same employment type, locality and period is covered with up to 20 co-occurrences shown in each of the following categories:

Application Platforms
1 20 (3.47%) CMS
2 16 (2.77%) OpenStack
3 15 (2.60%) Confluence
3 15 (2.60%) IIS
4 9 (1.56%) Drupal
4 9 (1.56%) Moodle
4 9 (1.56%) Totara
5 7 (1.21%) JBoss
6 6 (1.04%) nginx
7 5 (0.87%) Red Hat Fuse
8 4 (0.69%) Umbraco
9 3 (0.52%) Apache
9 3 (0.52%) Orchard CMS
9 3 (0.52%) SharePoint
9 3 (0.52%) WordPress
10 2 (0.35%) Headless CMS
10 2 (0.35%) Kentico
11 1 (0.17%) Sitecore CMS
Applications
1 41 (7.11%) Simulink
2 4 (0.69%) Microsoft Excel
3 2 (0.35%) MS Visio
3 2 (0.35%) Photoshop
4 1 (0.17%) Camtasia
4 1 (0.17%) Chatbot
4 1 (0.17%) Doxygen
4 1 (0.17%) GNU Octave
4 1 (0.17%) Microsoft Office
4 1 (0.17%) SketchUp
4 1 (0.17%) SOLIDWORKS
4 1 (0.17%) Spreadsheet
Business Applications
1 4 (0.69%) SDL Web 8
2 3 (0.52%) Dynamics CRM
3 1 (0.17%) Magento
Cloud Services
1 183 (31.72%) Azure
2 136 (23.57%) AWS
3 78 (13.52%) Azure DevOps
4 64 (11.09%) GitHub
5 46 (7.97%) SaaS
6 34 (5.89%) GCP
7 30 (5.20%) Serverless
8 20 (3.47%) Amazon EKS
9 19 (3.29%) Amazon ECS
10 15 (2.60%) Power Platform
11 14 (2.43%) Azure Cosmos DB
11 14 (2.43%) Azure Functions
11 14 (2.43%) Azure Service Bus
12 10 (1.73%) Azure AKS
12 10 (1.73%) Cloudflare
12 10 (1.73%) Entra ID
12 10 (1.73%) Microsoft 365
13 8 (1.39%) Pulumi
14 7 (1.21%) GitHub Actions
14 7 (1.21%) SonarCloud
Communications & Networking
1 15 (2.60%) Network Security
2 13 (2.25%) Firewall
3 12 (2.08%) DNS
4 11 (1.91%) VPN
5 10 (1.73%) DHCP
6 9 (1.56%) 5G
7 5 (0.87%) LAN
7 5 (0.87%) WAN
8 4 (0.69%) CTI
9 3 (0.52%) TCP/IP
10 2 (0.35%) J1939
11 1 (0.17%) HTTP
11 1 (0.17%) MQTT
11 1 (0.17%) RS-485
11 1 (0.17%) SSL
11 1 (0.17%) Unified Communications
11 1 (0.17%) VLAN
11 1 (0.17%) Wi-Fi
Database & Business Intelligence
1 102 (17.68%) NoSQL
2 80 (13.86%) SQL Server
3 76 (13.17%) MySQL
4 69 (11.96%) PostgreSQL
5 38 (6.59%) Relational Database
6 16 (2.77%) Elasticsearch
7 12 (2.08%) Azure SQL Database
8 8 (1.39%) Big Data
9 7 (1.21%) Power BI
9 7 (1.21%) SQL Server Reporting Services
10 6 (1.04%) MariaDB
11 5 (0.87%) Enterprise Data Warehouse
11 5 (0.87%) InfluxDB
11 5 (0.87%) MongoDB
12 4 (0.69%) Apache Cassandra
13 3 (0.52%) Couchbase
13 3 (0.52%) Data Warehouse
13 3 (0.52%) Hadoop
13 3 (0.52%) Power Query
13 3 (0.52%) Tableau
Development Applications
1 81 (14.04%) JIRA
1 81 (14.04%) Selenium
2 78 (13.52%) Visual Studio
3 74 (12.82%) Jenkins
4 52 (9.01%) Cypress.io
5 49 (8.49%) Team Foundation Server
6 42 (7.28%) Subversion
7 33 (5.72%) Vagrant
8 26 (4.51%) NUnit
9 24 (4.16%) GitLab
10 21 (3.64%) Octopus Deploy
10 21 (3.64%) SoapUI
11 16 (2.77%) Maven
11 16 (2.77%) MSBuild
12 15 (2.60%) Visual Studio Code
13 14 (2.43%) Bitbucket
13 14 (2.43%) Jasmine
14 12 (2.08%) gulp
14 12 (2.08%) JUnit
14 12 (2.08%) TeamCity
General
1 139 (24.09%) Social Skills
2 91 (15.77%) Finance
3 32 (5.55%) Analytical Skills
4 30 (5.20%) Aerospace
5 24 (4.16%) Electronics
6 22 (3.81%) Marketing
7 20 (3.47%) Public Sector
7 20 (3.47%) Telecoms
8 19 (3.29%) Games
9 18 (3.12%) Retail
10 17 (2.95%) Law
11 12 (2.08%) Manufacturing
11 12 (2.08%) Organisational Skills
12 8 (1.39%) Automotive
12 8 (1.39%) Multimedia
13 7 (1.21%) Inclusion and Diversity
14 6 (1.04%) Police
14 6 (1.04%) Wearables
15 5 (0.87%) Billing
16 3 (0.52%) Legal
Job Titles
1 302 (52.34%) Developer
2 162 (28.08%) Senior
3 111 (19.24%) Senior Developer
4 108 (18.72%) Software Engineer
5 55 (9.53%) PHP Developer
6 49 (8.49%) Lead
7 47 (8.15%) Software Developer
8 45 (7.80%) Front-End Developer (Client-Side Developer)
9 41 (7.11%) .NET Developer
10 40 (6.93%) DevOps Engineer
11 36 (6.24%) Full Stack Developer
12 32 (5.55%) Java Developer
12 32 (5.55%) SC Cleared Software Engineer
13 29 (5.03%) Azure DevOps Engineer
13 29 (5.03%) Azure Engineer
14 24 (4.16%) C# Developer
15 23 (3.99%) Software Team Leader
15 23 (3.99%) Team Leader
16 21 (3.64%) Development Team Leader
16 21 (3.64%) Software Development Team Leader
Libraries, Frameworks & Software Standards
1 177 (30.68%) .NET
1 177 (30.68%) HTML
2 166 (28.77%) CSS
3 139 (24.09%) React
4 88 (15.25%) REST
5 79 (13.69%) Web Services
6 76 (13.17%) HTML5
7 66 (11.44%) AngularJS
8 65 (11.27%) RESTful
9 60 (10.40%) ASP.NET
10 54 (9.36%) Laravel
11 52 (9.01%) Jest
12 49 (8.49%) .NET Framework
13 43 (7.45%) jQuery
14 41 (7.11%) CSS3
15 38 (6.59%) gRPC
15 38 (6.59%) Kafka
15 38 (6.59%) RabbitMQ
16 37 (6.41%) JSON
16 37 (6.41%) Spring
Miscellaneous
1 26 (4.51%) Distributed Systems
2 21 (3.64%) Mobile App
3 17 (2.95%) IoT
4 16 (2.77%) e-Learning
4 16 (2.77%) Product Ownership
5 14 (2.43%) Greenfield Project
5 14 (2.43%) Legacy Systems
6 12 (2.08%) Robotics
7 9 (1.56%) CUDA
8 8 (1.39%) Algorithms
9 7 (1.21%) Cybercrime
9 7 (1.21%) Linux Command Line
10 6 (1.04%) Client/Server
11 5 (0.87%) Blockchain
11 5 (0.87%) CAN bus
11 5 (0.87%) Enterprise Software
11 5 (0.87%) Hybrid Cloud
11 5 (0.87%) PKI
11 5 (0.87%) Self-Motivation
12 4 (0.69%) Animation
Operating Systems
1 122 (21.14%) Linux
2 63 (10.92%) Windows
3 48 (8.32%) Ubuntu
4 45 (7.80%) Android
5 39 (6.76%) CentOS
6 38 (6.59%) Red Hat Enterprise Linux
7 17 (2.95%) Windows 10
8 13 (2.25%) Windows Server
9 5 (0.87%) Windows Server 2012
9 5 (0.87%) Windows Server 2016
9 5 (0.87%) Windows Server 2019
10 3 (0.52%) Embedded Linux
10 3 (0.52%) Mac OS
11 2 (0.35%) VxWorks
12 1 (0.17%) Apple iOS
Processes & Methodologies
1 304 (52.69%) Agile
2 184 (31.89%) DevOps
2 184 (31.89%) Software Engineering
3 139 (24.09%) Computer Science
4 130 (22.53%) Artificial Intelligence
5 119 (20.62%) Microservices
6 109 (18.89%) Problem-Solving
7 101 (17.50%) TDD
8 89 (15.42%) CI/CD
9 78 (13.52%) Propensity Modelling
10 68 (11.79%) Machine Learning
11 67 (11.61%) Collaborative Working
12 60 (10.40%) Full Stack Development
13 59 (10.23%) Infrastructure as Code
14 57 (9.88%) Front End Development
15 55 (9.53%) Continuous Integration
16 50 (8.67%) Design Patterns
17 49 (8.49%) Web Development
18 48 (8.32%) MVC
19 46 (7.97%) Test Automation
Programming Languages
1 288 (49.91%) JavaScript
2 206 (35.70%) C#
3 152 (26.34%) SQL
4 121 (20.97%) Python
5 118 (20.45%) Java
6 112 (19.41%) PHP
7 107 (18.54%) TypeScript
8 87 (15.08%) C++
9 57 (9.88%) Go
10 47 (8.15%) PowerShell
11 45 (7.80%) C
12 40 (6.93%) Kotlin
13 31 (5.37%) Bash
14 17 (2.95%) Bicep
15 9 (1.56%) C-shell
15 9 (1.56%) Fortran
15 9 (1.56%) MATLAB
16 8 (1.39%) T-SQL
17 5 (0.87%) Perl
17 5 (0.87%) R
Qualifications
1 202 (35.01%) Degree
2 99 (17.16%) Computer Science Degree
3 75 (13.00%) Security Cleared
4 65 (11.27%) SC Cleared
5 16 (2.77%) Master's Degree
6 7 (1.21%) PhD
7 2 (0.35%) Azure Certification
7 2 (0.35%) BPSS Clearance
7 2 (0.35%) DV Cleared
7 2 (0.35%) Microsoft Certification
8 1 (0.17%) PMI Certification
Quality Assurance & Compliance
1 31 (5.37%) QA
2 27 (4.68%) WCAG
3 14 (2.43%) Accessibility
4 10 (1.73%) GDPR
5 5 (0.87%) Solvency II
6 2 (0.35%) Automotive SPICE
6 2 (0.35%) AUTOSAR
6 2 (0.35%) ISO 26262
6 2 (0.35%) MISRA
6 2 (0.35%) MISRA C
7 1 (0.17%) HIPAA
7 1 (0.17%) SLA
System Software
1 226 (39.17%) Docker
2 24 (4.16%) Virtual Machines
3 22 (3.81%) Active Directory
4 19 (3.29%) Hyper-V
5 9 (1.56%) NFS
5 9 (1.56%) pfSense
5 9 (1.56%) VMware Infrastructure
6 8 (1.39%) Firmware
7 5 (0.87%) Citrix Hypervisor
8 4 (0.69%) Embedded Firmware
Systems Management
1 157 (27.21%) Kubernetes
2 90 (15.60%) Ansible
3 78 (13.52%) Terraform
4 16 (2.77%) Grafana
5 11 (1.91%) Puppet
6 10 (1.73%) ZABBIX
7 9 (1.56%) Microsoft Data Protection Manager
7 9 (1.56%) SCDPM
8 7 (1.21%) MIIS
9 5 (0.87%) Prometheus
9 5 (0.87%) Red Hat Spacewalk
10 4 (0.69%) HP Quality Center
11 3 (0.52%) Docker Swarm
11 3 (0.52%) Podman
12 2 (0.35%) Kibana
13 1 (0.17%) cPanel
13 1 (0.17%) Graphite
13 1 (0.17%) Nagios
13 1 (0.17%) Plesk
Vendors
1 61 (10.57%) Microsoft
2 32 (5.55%) Xilinx
3 24 (4.16%) Google
4 18 (3.12%) VMware
5 15 (2.60%) Fortinet
6 14 (2.43%) Juniper
7 11 (1.91%) Atlassian
7 11 (1.91%) SAP
8 10 (1.73%) Oracle
8 10 (1.73%) WSO2
9 9 (1.56%) McAfee
9 9 (1.56%) Veeam
10 7 (1.21%) Red Hat
10 7 (1.21%) Sitecore
10 7 (1.21%) Xamarin
11 6 (1.04%) ForgeRock
12 5 (0.87%) Cisco
12 5 (0.87%) IBM
12 5 (0.87%) Veracode
13 4 (0.69%) Apple