Azure Jobs in Surrey

Microsoft Azure
South East > Surrey

The table below provides summary statistics for permanent job vacancies advertised in Surrey requiring Azure skills. It includes a benchmarking guide to the annual salaries offered in vacancies that cited Azure over the 6 months leading up to 9 October 2024, comparing them to the same period in the previous two years.

6 months to
9 Oct 2024
Same period 2023 Same period 2022
Rank 6 2 7
Rank change year-on-year -4 +5 -3
Permanent jobs citing Azure 352 288 539
As % of all permanent jobs advertised in Surrey 19.27% 26.06% 16.51%
As % of the Cloud Services category 65.43% 69.40% 41.95%
Number of salaries quoted 253 216 383
10th Percentile £40,000 £40,000 £30,500
25th Percentile £46,250 £46,250 £45,000
Median annual salary (50th Percentile) £65,000 £55,000 £60,000
Median % change year-on-year +18.18% -8.33% +9.09%
75th Percentile £77,500 £67,500 £77,500
90th Percentile £90,000 £73,125 £90,000
South East median annual salary £57,500 £56,525 £60,000
% change year-on-year +1.72% -5.79% +9.09%

All Cloud Skills
Surrey

Azure falls under the Cloud Services category. For comparison with the information above, the following table provides summary statistics for all permanent job vacancies requiring cloud computing skills in Surrey.

Permanent vacancies with a requirement for cloud computing skills 538 415 1,285
As % of all permanent jobs advertised in Surrey 29.45% 37.56% 39.37%
Number of salaries quoted 335 319 853
10th Percentile £40,000 £31,100 £30,500
25th Percentile £44,375 £41,250 £41,250
Median annual salary (50th Percentile) £60,000 £55,000 £57,500
Median % change year-on-year +9.09% -4.35% +4.55%
75th Percentile £75,000 £67,500 £75,000
90th Percentile £86,250 £75,000 £85,000
South East median annual salary £56,000 £55,000 £57,500
% change year-on-year +1.82% -4.35% +4.55%

Azure
Job Vacancy Trend in Surrey

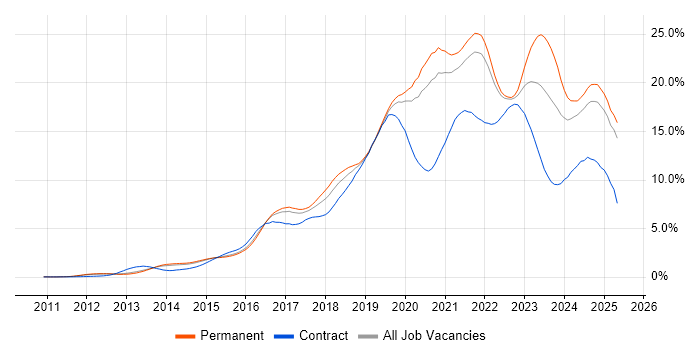
Job postings citing Azure as a proportion of all IT jobs advertised in Surrey.

Job vacancy trend for Azure in Surrey

Azure
Salary Trend in Surrey

3-month moving average salary quoted in jobs citing Azure in Surrey.

Salary trend for Azure in Surrey

Azure
Salary Histogram in Surrey

Salary distribution for jobs citing Azure in Surrey over the 6 months to 9 October 2024.

Salary histogram for Azure in Surrey

Azure
Job Locations in Surrey

The table below looks at the demand and provides a guide to the median salaries quoted in IT jobs citing Azure within the Surrey region over the 6 months to 9 October 2024. The 'Rank Change' column provides an indication of the change in demand within each location based on the same 6 month period last year.

Location Rank Change
on Same Period
Last Year
Matching
Permanent
IT Job Ads
Median Salary
Past 6 Months
Median Salary
% Change
on Same Period
Last Year
Live
Jobs
Woking -4 59 £45,000 -14.29% 6
Epsom +2 52 £65,000 +30.00% 8
Reigate -2 19 £82,500 +26.92% 3
Leatherhead -4 17 £52,500 - 3
Guildford -12 15 £70,000 +10.24% 3
Camberley +1 11 £80,000 +100.00% 1
Tadworth -4 11 £80,000 - 2
Weybridge -4 7 £75,000 +36.36%
Redhill -22 7 £45,000 -28.00% 1
Dorking - 6 £60,000 - 1
Egham -1 5 £67,500 +80.00% 3
Sunbury-on-Thames -7 5 - - 3
Walton-on-Thames -7 4 - -
Thames Ditton - 4 - -
East Molesey - 4 - -
Addlestone -14 3 £62,500 +47.06%
Staines -5 2 £57,500 +15.00% 1
Cobham - 2 £48,750 -
Cranleigh - 2 - -
Windlesham - 2 £28,500 -
Godalming -2 1 £52,500 -25.00% 1
Chertsey -4 1 £47,500 -32.14%
Azure
South East

Azure
Co-occurring Skills and Capabilities in Surrey by Category

The follow tables expand on the table above by listing co-occurrences grouped by category. The same employment type, locality and period is covered with up to 20 co-occurrences shown in each of the following categories:

Application Platforms
1 16 (4.55%) Microsoft Exchange
2 10 (2.84%) SharePoint
3 6 (1.70%) nginx
4 5 (1.42%) IIS
5 3 (0.85%) ArcGIS
6 2 (0.57%) Confluence
Applications
1 17 (4.83%) Simulink
2 8 (2.27%) Microsoft Office
3 6 (1.70%) Microsoft PowerPoint
4 5 (1.42%) Microsoft Excel
5 4 (1.14%) MS Visio
6 1 (0.28%) Microsoft Project
Business Applications
1 27 (7.67%) Dynamics CRM
2 2 (0.57%) SAP S/4HANA
3 1 (0.28%) Sparx Enterprise Architect
Cloud Services
1 104 (29.55%) AWS
2 87 (24.72%) Azure DevOps
3 40 (11.36%) Azure Data Factory
4 39 (11.08%) Entra ID
5 35 (9.94%) Microsoft 365
6 34 (9.66%) Azure Synapse Analytics
6 34 (9.66%) SaaS
7 30 (8.52%) GCP
8 29 (8.24%) Azure API Management
9 26 (7.39%) GitHub
10 22 (6.25%) GitHub Actions
11 21 (5.97%) Dynamics 365
12 20 (5.68%) Azure Service Bus
13 17 (4.83%) Azure Cosmos DB
14 13 (3.69%) IaaS
14 13 (3.69%) Power Platform
15 11 (3.13%) SonarCloud
16 10 (2.84%) Cloudflare
17 9 (2.56%) Amazon CloudWatch
17 9 (2.56%) PowerApps
Communications & Networking
1 28 (7.95%) 5G
1 28 (7.95%) Broadband
2 13 (3.69%) DNS
3 12 (3.41%) Firewall
4 6 (1.70%) LAN
4 6 (1.70%) Network Security
4 6 (1.70%) WAN
5 4 (1.14%) BGP
5 4 (1.14%) iSCSI
5 4 (1.14%) NetScaler
5 4 (1.14%) OSPF
5 4 (1.14%) RIP
5 4 (1.14%) Wi-Fi
6 3 (0.85%) DHCP
6 3 (0.85%) TCP/IP
6 3 (0.85%) Wireless
7 2 (0.57%) IP Telephony
7 2 (0.57%) SSH
7 2 (0.57%) VoIP
7 2 (0.57%) VPN
Database & Business Intelligence
1 34 (9.66%) Azure SQL Database
2 29 (8.24%) PostgreSQL
3 28 (7.95%) MongoDB
4 26 (7.39%) Hadoop
4 26 (7.39%) NoSQL
5 25 (7.10%) SQL Server
6 16 (4.55%) Elasticsearch
7 12 (3.41%) Data Warehouse
7 12 (3.41%) Power BI
8 7 (1.99%) Relational Database
9 6 (1.70%) Big Data
10 4 (1.14%) BigQuery
10 4 (1.14%) Looker
10 4 (1.14%) MariaDB
10 4 (1.14%) MySQL
11 2 (0.57%) Microsoft Analysis Services
12 1 (0.28%) Data Lake
12 1 (0.28%) Redis
12 1 (0.28%) SQL Server Integration Services
12 1 (0.28%) SQLite
Development Applications
1 50 (14.20%) Git
2 26 (7.39%) Visual Studio
3 20 (5.68%) MSBuild
4 19 (5.40%) Team Foundation Server
5 18 (5.11%) Vagrant
6 17 (4.83%) JIRA
6 17 (4.83%) Octopus Deploy
7 16 (4.55%) Postman
8 9 (2.56%) Selenium
9 6 (1.70%) Artifactory
9 6 (1.70%) SonarQube
10 5 (1.42%) eggPlant
10 5 (1.42%) Jenkins
11 3 (0.85%) GitLab
11 3 (0.85%) JMeter
11 3 (0.85%) Newman
11 3 (0.85%) REST Assured
11 3 (0.85%) Subversion
12 2 (0.57%) Axure RP
12 2 (0.57%) Visual Studio Code
General
1 68 (19.32%) Social Skills
2 67 (19.03%) Finance
3 66 (18.75%) Analytical Skills
4 40 (11.36%) Inclusion and Diversity
5 21 (5.97%) Automotive
6 19 (5.40%) Public Sector
7 15 (4.26%) Electronics
8 13 (3.69%) Marketing
9 12 (3.41%) Telecoms
10 10 (2.84%) Advertising
10 10 (2.84%) Aerospace
10 10 (2.84%) Manufacturing
11 7 (1.99%) Law
11 7 (1.99%) Legal
12 6 (1.70%) Retail
13 4 (1.14%) Banking
14 3 (0.85%) Pharmaceutical
15 2 (0.57%) Music Industry
16 1 (0.28%) Documentation Skills
16 1 (0.28%) Military
Job Titles
1 77 (21.88%) Senior
2 64 (18.18%) Developer
3 47 (13.35%) Architect
4 45 (12.78%) DevOps Engineer
4 45 (12.78%) Software Engineer
5 32 (9.09%) Azure Engineer
6 28 (7.95%) Linux Specialist
6 28 (7.95%) Technical Specialist
7 27 (7.67%) Data Architect
8 21 (5.97%) .NET Developer
8 21 (5.97%) Senior Developer
9 20 (5.68%) CRM Developer
9 20 (5.68%) Dynamics CRM Developer
10 17 (4.83%) Azure DevOps Engineer
10 17 (4.83%) C# Developer
10 17 (4.83%) SC Cleared Software Engineer
10 17 (4.83%) Senior Data Warehouse Specialist
11 15 (4.26%) Lead
12 14 (3.98%) Microsoft Developer
12 14 (3.98%) Senior Unix Technical Specialist
Libraries, Frameworks & Software Standards
1 112 (31.82%) .NET
2 44 (12.50%) REST
3 38 (10.80%) Middleware
4 32 (9.09%) ASP.NET
5 30 (8.52%) Node.js
6 28 (7.95%) Kafka
7 24 (6.82%) HTML
8 23 (6.53%) CSS
9 19 (5.40%) SOAP
10 16 (4.55%) Swagger
10 16 (4.55%) YAML
11 14 (3.98%) XML
12 13 (3.69%) JSON
12 13 (3.69%) Twitter Bootstrap
13 12 (3.41%) .NET Framework
14 11 (3.13%) AngularJS
14 11 (3.13%) gRPC
15 10 (2.84%) React
16 8 (2.27%) ARM Templates
16 8 (2.27%) ASP.NET Core
Miscellaneous
1 30 (8.52%) Product Ownership
2 28 (7.95%) Social Media
3 11 (3.13%) IoT
4 9 (2.56%) Linux Command Line
5 8 (2.27%) Cloud Native
5 8 (2.27%) Greenfield Project
6 7 (1.99%) Legacy Systems
7 6 (1.70%) BYOD
8 5 (1.42%) Data Centre
8 5 (1.42%) Self-Motivation
9 4 (1.14%) Client/Server
9 4 (1.14%) Hybrid Cloud
10 3 (0.85%) Cyber Threat
10 3 (0.85%) EMC VMAX
10 3 (0.85%) Management Information System
10 3 (0.85%) Onboarding
10 3 (0.85%) Replication
11 2 (0.57%) Enterprise Software
11 2 (0.57%) Low-Code
11 2 (0.57%) NB-IoT
Operating Systems
1 72 (20.45%) Linux
2 53 (15.06%) Ubuntu
3 42 (11.93%) Windows
4 19 (5.40%) Windows Server
5 18 (5.11%) Android
5 18 (5.11%) CentOS
5 18 (5.11%) Red Hat Enterprise Linux
6 6 (1.70%) Windows 10
7 5 (1.42%) Windows Server 2008
8 4 (1.14%) Debian
9 3 (0.85%) Unix
10 2 (0.57%) Apple iOS
11 1 (0.28%) VMS
Processes & Methodologies
1 127 (36.08%) DevOps
2 73 (20.74%) Agile
3 68 (19.32%) Software Engineering
4 66 (18.75%) Problem-Solving
5 55 (15.63%) Artificial Intelligence
5 55 (15.63%) CRM
6 52 (14.77%) CI/CD
7 49 (13.92%) Cybersecurity
8 46 (13.07%) Microservices
9 37 (10.51%) Scrum
10 36 (10.23%) Computer Science
11 32 (9.09%) Mentoring
12 31 (8.81%) Analytics
12 31 (8.81%) IT Strategy
13 30 (8.52%) Technology Strategy
14 29 (8.24%) API Management
15 27 (7.67%) Code Quality
15 27 (7.67%) Machine Learning
16 26 (7.39%) Infrastructure as Code
17 25 (7.10%) ITIL
Programming Languages
1 125 (35.51%) SQL
2 120 (34.09%) C#
3 116 (32.95%) Python
4 68 (19.32%) JavaScript
5 58 (16.48%) Java
6 43 (12.22%) Bash
7 29 (8.24%) C++
8 24 (6.82%) PowerShell
9 18 (5.11%) Kotlin
10 11 (3.13%) Perl
11 9 (2.56%) C
11 9 (2.56%) VB.NET
12 8 (2.27%) Bicep
13 3 (0.85%) Data Analysis Expressions
13 3 (0.85%) R
14 2 (0.57%) F#
14 2 (0.57%) T-SQL
14 2 (0.57%) TypeScript
15 1 (0.28%) Scala
Qualifications
1 97 (27.56%) Degree
2 73 (20.74%) Security Cleared
3 67 (19.03%) SC Cleared
4 37 (10.51%) Azure Certification
5 30 (8.52%) Computer Science Degree
6 23 (6.53%) DV Cleared
7 9 (2.56%) Microsoft Certification
8 5 (1.42%) TOGAF Certification
9 2 (0.57%) A+ Certification
9 2 (0.57%) ITIL Certification
10 1 (0.28%) AWS Certification
10 1 (0.28%) CBAP
10 1 (0.28%) DBS Check
10 1 (0.28%) IIBA
10 1 (0.28%) MCP
10 1 (0.28%) MCSA
10 1 (0.28%) PMI Certification
10 1 (0.28%) PMP
Quality Assurance & Compliance
1 19 (5.40%) QA
2 16 (4.55%) GDPR
3 14 (3.98%) Data Quality
4 6 (1.70%) SLA
4 6 (1.70%) Solvency II
5 3 (0.85%) Accessibility
6 2 (0.57%) Cyber Essentials
6 2 (0.57%) Cyber Essentials PLUS
6 2 (0.57%) ISO/IEC 27001
6 2 (0.57%) PCI DSS
7 1 (0.28%) COBIT
7 1 (0.28%) NIST
System Software
1 58 (16.48%) Active Directory
2 38 (10.80%) Docker
3 32 (9.09%) VMware Infrastructure
4 22 (6.25%) Virtual Machines
5 10 (2.84%) Virtual Desktop
6 8 (2.27%) Hyper-V
7 6 (1.70%) NFS
8 4 (1.14%) Firmware
8 4 (1.14%) pfSense
8 4 (1.14%) vSphere
9 2 (0.57%) Samba
9 2 (0.57%) VMware Workstation
Systems Management
1 38 (10.80%) Terraform
2 31 (8.81%) Microsoft Intune
3 28 (7.95%) Jamf Pro
4 23 (6.53%) Ansible
5 21 (5.97%) Kubernetes
6 9 (2.56%) Nagios
7 7 (1.99%) Grafana
7 7 (1.99%) Prometheus
8 4 (1.14%) SCCM
9 3 (0.85%) NetBackup
10 2 (0.57%) ZABBIX
11 1 (0.28%) Podman
11 1 (0.28%) Puppet
11 1 (0.28%) Single Sign-On
Vendors
1 140 (39.77%) Microsoft
2 34 (9.66%) VMware
3 32 (9.09%) Databricks
4 31 (8.81%) CyberArk
5 28 (7.95%) Tanium
6 17 (4.83%) Xilinx
7 13 (3.69%) Cisco
8 12 (3.41%) SAP
9 7 (1.99%) NetApp
10 6 (1.70%) Veracode
11 4 (1.14%) Aruba
11 4 (1.14%) CheckPoint
11 4 (1.14%) Citrix
11 4 (1.14%) Google
11 4 (1.14%) QNAP
11 4 (1.14%) Synology
11 4 (1.14%) Ubiquiti
12 3 (0.85%) Dell
12 3 (0.85%) Red Hat
12 3 (0.85%) Salesforce