Terraform Contracts in the City of London

Terraform
Central London > City of London

The following table provides summary statistics for contract job vacancies advertised in the City of London with a requirement for Terraform skills. Included is a benchmarking guide to the contractor rates offered in vacancies that have cited Terraform over the 6 months to 27 April 2024 with a comparison to the same period in the previous 2 years.

6 months to
27 Apr 2024
Same period 2023 Same period 2022
Rank 52 49 27
Rank change year-on-year -3 -22 +37
Contract jobs citing Terraform 78 162 292
As % of all contract jobs advertised in the City of London 3.54% 4.45% 6.90%
As % of the Systems Management category 28.16% 27.98% 38.02%
Number of daily rates quoted 55 105 248
10th Percentile £417 £475 £475
25th Percentile £489 £525 £519
Median daily rate (50th Percentile) £550 £650 £600
Median % change year-on-year -15.38% +8.33% +9.09%
75th Percentile £650 £713 £738
90th Percentile £733 £758 £810
Central London median daily rate £550 £650 £600
% change year-on-year -15.38% +8.33% +9.09%
Number of hourly rates quoted 1 4 0
10th Percentile - - -
25th Percentile £46.75 £79.89 -
Median hourly rate £48.50 £84.09 -
Median % change year-on-year -42.32% - -
75th Percentile £50.25 £88.30 -
90th Percentile - - -
Central London median hourly rate £48.50 £84.09 -
% change year-on-year -42.32% - -

All Systems Management Skills
City of London

Terraform is in the Systems Management category. The following table is for comparison with the above and provides summary statistics for all contract job vacancies advertised in the City of London with a requirement for systems management skills.

Contract vacancies with a requirement for systems management skills 277 579 768
As % of all contract IT jobs advertised in the City of London 12.58% 15.92% 18.14%
Number of daily rates quoted 195 397 632
10th Percentile £335 £398 £425
25th Percentile £422 £510 £513
Median daily rate (50th Percentile) £540 £600 £575
Median % change year-on-year -10.00% +4.35% +4.55%
75th Percentile £650 £700 £700
90th Percentile £748 £775 £788
Central London median daily rate £525 £600 £589
% change year-on-year -12.50% +1.91% +7.05%
Number of hourly rates quoted 4 5 3
10th Percentile - £44.09 £27.20
25th Percentile £12.75 £79.89 £30.13
Median hourly rate £20.25 £84.09 £35.00
Median % change year-on-year -75.92% +140.26% +52.17%
75th Percentile £32.81 £88.30 £56.88
90th Percentile £43.28 - £70.00
Central London median hourly rate £20.25 £84.09 £35.00
% change year-on-year -75.92% +140.26% +52.17%

Terraform
Job Vacancy Trend in the City of London

Job postings citing Terraform as a proportion of all IT jobs advertised in the City of London.
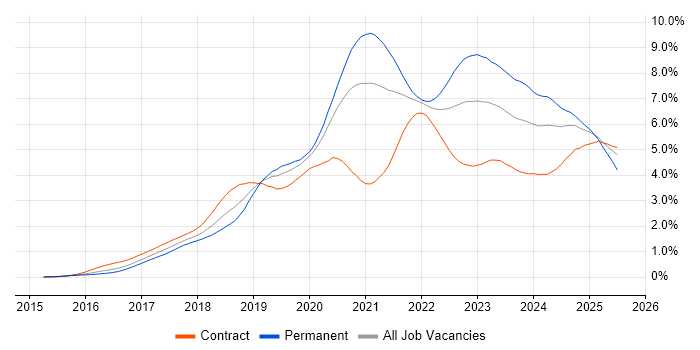
Job vacancy trend for Terraform in the City of London

Terraform
Contractor Daily Rate Trend in the City of London

3-month moving average daily rate quoted in jobs citing Terraform in the City of London.

Daily rate trend for Terraform in the City of London

Terraform
Daily Rate Histogram in the City of London

Daily rate distribution for jobs citing Terraform in the City of London over the 6 months to 27 April 2024.

Daily rate histogram for Terraform in the City of London

Terraform
Contractor Hourly Rate Trend in the City of London

3-month moving average hourly rates quoted in jobs citing Terraform in the City of London.

Hourly rate trend for Terraform in the City of London

Terraform
Co-occurring Skills and Capabilities in the City of London by Category

The follow tables expand on the table above by listing co-occurrences grouped by category. The same employment type, locality and period is covered with up to 20 co-occurrences shown in each of the following categories:

Application Platforms
1 2 (2.56%) Apache Spark
1 2 (2.56%) nginx
1 2 (2.56%) Tomcat
2 1 (1.28%) Apache
2 1 (1.28%) Apache Airflow
2 1 (1.28%) Confluence
2 1 (1.28%) IIS
2 1 (1.28%) Jupyter
Applications
1 1 (1.28%) Weka
Business Applications
1 1 (1.28%) Oracle BPM
Cloud Services
1 45 (57.69%) AWS
2 33 (42.31%) Azure
3 23 (29.49%) GitHub
4 17 (21.79%) Serverless
5 14 (17.95%) GitHub Actions
6 12 (15.38%) AWS Lambda
6 12 (15.38%) GCP
7 11 (14.10%) Amazon S3
8 10 (12.82%) AWS CloudFormation
9 9 (11.54%) Azure AKS
10 8 (10.26%) Amazon EC2
10 8 (10.26%) Azure DevOps
11 7 (8.97%) Amazon EKS
12 6 (7.69%) Azure Functions
13 5 (6.41%) Azure Service Bus
13 5 (6.41%) Virtual Private Cloud
14 4 (5.13%) IaaS
14 4 (5.13%) PaaS
15 3 (3.85%) Amazon Kinesis
15 3 (3.85%) Amazon SQS
Communications & Networking
1 5 (6.41%) DNS
2 3 (3.85%) Firewall
3 1 (1.28%) DHCP
3 1 (1.28%) Kerberos
3 1 (1.28%) SD-WAN
3 1 (1.28%) TCP/IP
3 1 (1.28%) VLAN
3 1 (1.28%) VPN
3 1 (1.28%) WAN
Database & Business Intelligence
1 6 (7.69%) Amazon RDS
2 5 (6.41%) Elasticsearch
2 5 (6.41%) MySQL
3 4 (5.13%) Amazon Athena
3 4 (5.13%) PostgreSQL
3 4 (5.13%) Relational Database
4 3 (3.85%) Data Warehouse
4 3 (3.85%) NoSQL
4 3 (3.85%) Tableau
5 2 (2.56%) Amazon Aurora
5 2 (2.56%) Amazon Redshift
5 2 (2.56%) Big Data
5 2 (2.56%) BigQuery
5 2 (2.56%) DynamoDB
5 2 (2.56%) RDBMS
5 2 (2.56%) SQL Server
6 1 (1.28%) Data Lake
6 1 (1.28%) Parquet
6 1 (1.28%) Scylla
6 1 (1.28%) Sisense
Development Applications
1 18 (23.08%) Jenkins
2 13 (16.67%) GitLab
3 11 (14.10%) Git
4 6 (7.69%) Bitbucket
4 6 (7.69%) Maven
5 5 (6.41%) Cypress.io
5 5 (6.41%) JMeter
6 3 (3.85%) CircleCI
6 3 (3.85%) JUnit
6 3 (3.85%) Mockito
6 3 (3.85%) SonarQube
6 3 (3.85%) TestNG
7 2 (2.56%) Cucumber
7 2 (2.56%) EasyMock
7 2 (2.56%) JIRA
7 2 (2.56%) Postman
7 2 (2.56%) Selenium
7 2 (2.56%) Subversion
7 2 (2.56%) TeamCity
7 2 (2.56%) Terragrunt
General
1 21 (26.92%) Finance
2 18 (23.08%) Social Skills
3 8 (10.26%) Public Sector
4 6 (7.69%) Banking
5 2 (2.56%) Analytical Skills
6 1 (1.28%) Documentation Skills
6 1 (1.28%) Financial Institution
6 1 (1.28%) Legal
6 1 (1.28%) Presentation Skills
6 1 (1.28%) Retail
Job Titles
1 22 (28.21%) DevOps Engineer
2 16 (20.51%) Platform Engineer
3 11 (14.10%) AWS Engineer
4 9 (11.54%) Cloud Engineer
5 8 (10.26%) Senior
6 7 (8.97%) Azure Engineer
6 7 (8.97%) Data Engineer
7 6 (7.69%) Architect
7 6 (7.69%) AWS DevOps
7 6 (7.69%) Cloud Platform Engineer
8 5 (6.41%) AWS DevOps Engineer
8 5 (6.41%) Developer
8 5 (6.41%) Lead
8 5 (6.41%) Senior DevOps
9 4 (5.13%) Senior Cloud Engineer
9 4 (5.13%) Senior DevOps Engineer
10 3 (3.85%) Azure DevOps Engineer
10 3 (3.85%) Lead DevOps
11 2 (2.56%) AWS Architect
11 2 (2.56%) Full Stack Developer
Libraries, Frameworks & Software Standards
1 14 (17.95%) Kafka
2 8 (10.26%) Elastic Stack
3 7 (8.97%) React
4 5 (6.41%) Node.js
5 4 (5.13%) Spring
5 4 (5.13%) YAML
6 3 (3.85%) JSON
6 3 (3.85%) Middleware
6 3 (3.85%) REST
6 3 (3.85%) RESTful
6 3 (3.85%) Spring Boot
7 2 (2.56%) ARM Templates
7 2 (2.56%) Gherkin
7 2 (2.56%) JAX-RS
7 2 (2.56%) Mustache
7 2 (2.56%) OpenAPI
7 2 (2.56%) PySpark
7 2 (2.56%) RabbitMQ
7 2 (2.56%) Swagger
7 2 (2.56%) WireMock
Miscellaneous
1 8 (10.26%) Public Cloud
2 7 (8.97%) Distributed Systems
3 3 (3.85%) Cloud Native
3 3 (3.85%) Machine to Machine
4 2 (2.56%) Enterprise Cloud
4 2 (2.56%) Enterprise Software
4 2 (2.56%) PKI
4 2 (2.56%) Product Ownership
5 1 (1.28%) CBDC
5 1 (1.28%) Cloud Security Posture
5 1 (1.28%) Data Centre
5 1 (1.28%) Digital Currency
5 1 (1.28%) Distributed Architecture
5 1 (1.28%) Distributed Computing
5 1 (1.28%) Greenfield Project
5 1 (1.28%) Legacy Systems
5 1 (1.28%) Private Cloud
5 1 (1.28%) Security Posture
5 1 (1.28%) Team-Oriented Environment
5 1 (1.28%) Virtual Team
Operating Systems
1 21 (26.92%) Linux
2 8 (10.26%) Windows
3 6 (7.69%) Windows Server
4 3 (3.85%) Red Hat Enterprise Linux
5 2 (2.56%) Windows Server 2012
5 2 (2.56%) Windows Server 2019
6 1 (1.28%) Android
6 1 (1.28%) Apple iOS
6 1 (1.28%) Unix
6 1 (1.28%) Windows 10
6 1 (1.28%) Windows Server 2016
Processes & Methodologies
1 48 (61.54%) DevOps
2 40 (51.28%) CI/CD
3 35 (44.87%) Infrastructure as Code
4 21 (26.92%) Platform Engineering
5 12 (15.38%) Agile
6 11 (14.10%) Microservices
7 9 (11.54%) Containerisation
8 8 (10.26%) Architectural Design
9 7 (8.97%) Cloud Security
9 7 (8.97%) Problem-Solving
9 7 (8.97%) Test Automation
10 6 (7.69%) Continuous Integration
10 6 (7.69%) Identity Access Management
10 6 (7.69%) Software Engineering
11 5 (6.41%) DevSecOps
11 5 (6.41%) Migration
11 5 (6.41%) Resource Management
11 5 (6.41%) Service Catalogue
11 5 (6.41%) Site Reliability Engineering
11 5 (6.41%) Technical Leadership
Programming Languages
1 44 (56.41%) Python
2 16 (20.51%) Bash
3 13 (16.67%) PowerShell
4 9 (11.54%) Java
4 9 (11.54%) SQL
5 6 (7.69%) Go
6 2 (2.56%) C
6 2 (2.56%) C#
6 2 (2.56%) Scala
6 2 (2.56%) TypeScript
7 1 (1.28%) C++
7 1 (1.28%) Groovy
7 1 (1.28%) JavaScript
7 1 (1.28%) Kotlin
7 1 (1.28%) Perl
7 1 (1.28%) R
7 1 (1.28%) Ruby
7 1 (1.28%) Rust
7 1 (1.28%) Shell Script
7 1 (1.28%) T-SQL
Qualifications
1 18 (23.08%) Security Cleared
2 17 (21.79%) SC Cleared
3 7 (8.97%) AWS Certification
4 5 (6.41%) AWS Certified Solutions Architect
5 3 (3.85%) AWS Certified DevOps Engineer
5 3 (3.85%) Degree
6 2 (2.56%) Azure Certification
6 2 (2.56%) Computer Science Degree
6 2 (2.56%) SANS
7 1 (1.28%) AWS Certified Developer
7 1 (1.28%) AWS Certified SysOps Administrator
7 1 (1.28%) Oracle Certification
Quality Assurance & Compliance
1 3 (3.85%) ISO/IEC 27001
1 3 (3.85%) NIST
1 3 (3.85%) QA
2 1 (1.28%) Data Quality
2 1 (1.28%) GDPR
2 1 (1.28%) ISO 20022
2 1 (1.28%) NCSC
2 1 (1.28%) PCI DSS
System Software
1 27 (34.62%) Docker
2 3 (3.85%) Active Directory
3 1 (1.28%) Ceph
3 1 (1.28%) KVM
3 1 (1.28%) Lustre
3 1 (1.28%) NFS
3 1 (1.28%) Virtual Machines
Systems Management
1 41 (52.56%) Kubernetes
2 20 (25.64%) Ansible
3 6 (7.69%) Argo
3 6 (7.69%) Puppet
4 5 (6.41%) Packer
4 5 (6.41%) Progress Chef
4 5 (6.41%) Prometheus
5 4 (5.13%) Consul
6 3 (3.85%) Grafana
7 2 (2.56%) Graylog
7 2 (2.56%) Kibana
7 2 (2.56%) Kustomize
7 2 (2.56%) logstash
7 2 (2.56%) Nagios
8 1 (1.28%) Check_MK
8 1 (1.28%) Hadoop YARN
8 1 (1.28%) Mesos
8 1 (1.28%) Nessus
8 1 (1.28%) Salt
8 1 (1.28%) WebInspect
Vendors
1 8 (10.26%) Microsoft
2 5 (6.41%) Red Hat
3 4 (5.13%) Splunk
4 3 (3.85%) IBM
5 2 (2.56%) Google
5 2 (2.56%) MKS
5 2 (2.56%) New Relic
5 2 (2.56%) Oracle
6 1 (1.28%) Adobe
6 1 (1.28%) Aruba
6 1 (1.28%) Checkmarx
6 1 (1.28%) Cisco
6 1 (1.28%) Databricks
6 1 (1.28%) Dynatrace
6 1 (1.28%) Juniper
6 1 (1.28%) PagerDuty
6 1 (1.28%) Salesforce
6 1 (1.28%) SAP
6 1 (1.28%) Veracode
6 1 (1.28%) Zscaler