Telecoms Contract Job Trends in the City of London

Telecommunications
Central London > City of London

The table below looks at the prevalence of the term Telecoms in contract job vacancies in the City of London. Included is a benchmarking guide to the contractor rates offered in vacancies that cited Telecoms over the 6 months leading up to 18 November 2025, comparing them to the same period in the previous two years.

6 months to
18 Nov 2025
Same period 2024 Same period 2023
Rank 100 72 103
Rank change year-on-year -28 +31 +33
Contract jobs citing Telecoms 26 50 46
As % of all contract jobs in the City of London 1.48% 2.39% 1.67%
As % of the General category 1.99% 3.54% 2.57%
Number of daily rates quoted 19 20 37
10th Percentile £406 £364 £353
25th Percentile £461 £431 £450
Median daily rate (50th Percentile) £525 £525 £560
Median % change year-on-year - -6.25% -6.67%
75th Percentile £575 £628 £650
90th Percentile £678 £676 £700
Central London median daily rate £500 £523 £544
% change year-on-year -4.31% -3.91% -9.38%
Number of hourly rates quoted 1 5 0
10th Percentile - £40.25 -
25th Percentile £19.79 £53.75 -
Median hourly rate £20.19 £77.50 -
Median % change year-on-year -73.95% - -
75th Percentile £20.60 £92.50 -
90th Percentile - £126.25 -
Central London median hourly rate £20.19 £77.50 -
% change year-on-year -73.95% - -

All General Skills
City of London

Telecoms falls under the General Skills category. For comparison with the information above, the following table provides summary statistics for all contract job vacancies requiring common skills in the City of London.

Contract vacancies with a requirement for common skills 1,306 1,413 1,790
As % of all contract IT jobs advertised in the City of London 74.16% 67.67% 65.14%
Number of daily rates quoted 903 853 1,266
10th Percentile £325 £350 £363
25th Percentile £413 £463 £473
Median daily rate (50th Percentile) £550 £580 £600
Median % change year-on-year -5.17% -3.33% +3.00%
75th Percentile £675 £688 £699
90th Percentile £775 £788 £825
Central London median daily rate £550 £580 £589
% change year-on-year -5.17% -1.49% +2.39%
Number of hourly rates quoted 17 8 12
10th Percentile £16.85 £13.18 -
25th Percentile £20.18 £23.75 £17.00
Median hourly rate £28.00 £45.00 £25.75
Median % change year-on-year -37.78% +74.76% -39.77%
75th Percentile £47.50 £82.19 £52.25
90th Percentile £64.48 £109.38 £73.25
Central London median hourly rate £28.00 £35.00 £27.50
% change year-on-year -20.00% +27.27% -35.29%

Telecoms
Job Vacancy Trend in the City of London

Historical trend showing the proportion of contract IT job postings citing Telecoms relative to all contract IT jobs advertised in the City of London.
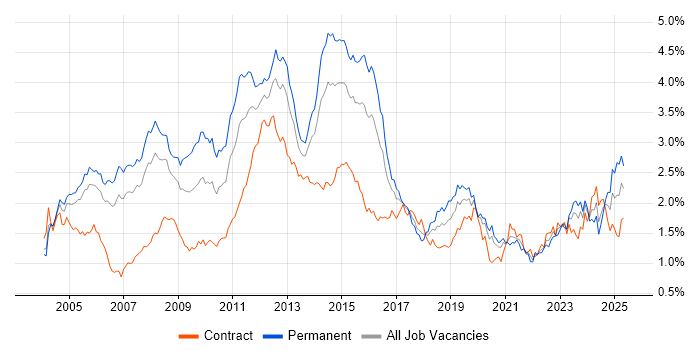
Telecoms job vacancy trend in the City of London

Telecoms
Daily Rate Trend in the City of London

Contractor daily rate distribution trend for jobs in the City of London citing Telecoms.

Contractor daily rate distribution trend for jobs in the City of London citing Telecoms

Telecoms
Daily Rate Histogram in the City of London

Daily rate distribution for jobs citing Telecoms in the City of London over the 6 months to 18 November 2025.

Daily rate histogram for Telecoms in the City of London

Telecoms
Hourly Rate Trend in the City of London

Contractor hourly rate distribution trend for jobs in the City of London citing Telecoms.

Contractor hourly rate distribution trend for jobs in the City of London citing Telecoms

Telecoms
Co-Occurring Skills & Capabilities in the City of London by Category

The following tables expand on the one above by listing co-occurrences grouped by category. They cover the same employment type, locality and period, with up to 20 co-occurrences shown in each category:

Application Platforms
1 3 (11.54%) Confluence
1 3 (11.54%) SharePoint
Applications
1 3 (11.54%) Microsoft Excel
1 3 (11.54%) Microsoft PowerPoint
1 3 (11.54%) Microsoft Project
1 3 (11.54%) MS Visio
Cloud Services
1 2 (7.69%) Apigee
1 2 (7.69%) AWS
1 2 (7.69%) GCP
1 2 (7.69%) GitHub
1 2 (7.69%) Google Kubernetes Engine
1 2 (7.69%) Microsoft 365
1 2 (7.69%) SaaS
1 2 (7.69%) Stackdriver
2 1 (3.85%) Azure
2 1 (3.85%) BrowserStack
2 1 (3.85%) Miro
Communications & Networking
1 3 (11.54%) LAN
1 3 (11.54%) Structured Cabling
1 3 (11.54%) WAN
2 2 (7.69%) Firewall
2 2 (7.69%) Intrusion Detection
2 2 (7.69%) Modbus
2 2 (7.69%) Softphone
2 2 (7.69%) Wireless
3 1 (3.85%) 2G
3 1 (3.85%) 4G
3 1 (3.85%) 5G
3 1 (3.85%) BGP
3 1 (3.85%) DNS
3 1 (3.85%) MPLS
3 1 (3.85%) Radio Access Network
Database & Business Intelligence
1 1 (3.85%) GIS
Development Applications
1 3 (11.54%) GitLab
1 3 (11.54%) JIRA
2 2 (7.69%) Gradle
2 2 (7.69%) Maven
3 1 (3.85%) Cypress.io
3 1 (3.85%) Postman
General
1 9 (34.62%) Finance
2 5 (19.23%) Social Skills
3 4 (15.38%) Manufacturing
4 3 (11.54%) Marketing
5 2 (7.69%) Analytical Skills
5 2 (7.69%) Electronics
5 2 (7.69%) Legal
5 2 (7.69%) Public Sector
6 1 (3.85%) Back Office
6 1 (3.85%) Banking
6 1 (3.85%) French Language
6 1 (3.85%) Inclusion and Diversity
6 1 (3.85%) Influencing Skills
Job Titles
1 5 (19.23%) IT Manager
2 4 (15.38%) Developer
3 3 (11.54%) IT Project Manager
3 3 (11.54%) Lead
3 3 (11.54%) Procurement Manager
3 3 (11.54%) Project Manager
4 2 (7.69%) Analyst
4 2 (7.69%) Angular Developer
4 2 (7.69%) Business Analyst
4 2 (7.69%) Category Manager
4 2 (7.69%) Cybersecurity Engineer
4 2 (7.69%) Front-End Developer (Client-Side Developer)
4 2 (7.69%) Infrastructure Specialist
4 2 (7.69%) Network Manager
4 2 (7.69%) Network Project Manager
4 2 (7.69%) Security Engineer
4 2 (7.69%) Senior
4 2 (7.69%) Senior Security Engineer
5 1 (3.85%) Data Centre Manager
5 1 (3.85%) Network Specialist
Libraries, Frameworks & Software Standards
1 2 (7.69%) AngularJS
1 2 (7.69%) CSS
1 2 (7.69%) GraphQL
1 2 (7.69%) HTML
1 2 (7.69%) HTML5
1 2 (7.69%) Next.js
1 2 (7.69%) Node.js
1 2 (7.69%) React
Miscellaneous
1 6 (23.08%) Data Centre
2 2 (7.69%) Insider Threat
2 2 (7.69%) iPad
2 2 (7.69%) IVR
2 2 (7.69%) Life Science
2 2 (7.69%) Management Information System
2 2 (7.69%) Operational Technology
2 2 (7.69%) Renewable Energy
2 2 (7.69%) SCADA
2 2 (7.69%) Security Posture
2 2 (7.69%) Video Conferencing
3 1 (3.85%) IoT
3 1 (3.85%) NB-IoT
Operating Systems
1 5 (19.23%) Windows
2 4 (15.38%) Windows Server
Processes & Methodologies
1 5 (19.23%) Change Management
1 5 (19.23%) Scrum
2 4 (15.38%) Agile
2 4 (15.38%) Logistics
2 4 (15.38%) Network Design
2 4 (15.38%) Problem-Solving
3 3 (11.54%) Analytics
3 3 (11.54%) Continuous Improvement
3 3 (11.54%) Cost Optimisation
3 3 (11.54%) Decision-Making
3 3 (11.54%) DevOps
3 3 (11.54%) ITIL
3 3 (11.54%) Migration
3 3 (11.54%) Project Delivery
3 3 (11.54%) Project Management
3 3 (11.54%) Server Management
3 3 (11.54%) Stakeholder Engagement
3 3 (11.54%) Stakeholder Management
3 3 (11.54%) Time Management
3 3 (11.54%) User Acceptance Testing
Programming Languages
1 2 (7.69%) TypeScript
2 1 (3.85%) JavaScript
2 1 (3.85%) SQL
Qualifications
1 8 (30.77%) Degree
2 3 (11.54%) Cisco Certification
3 2 (7.69%) BPSS Clearance
3 2 (7.69%) CCNA
3 2 (7.69%) CCNP
4 1 (3.85%) CCIE
4 1 (3.85%) JNCIE
4 1 (3.85%) JNCIP
4 1 (3.85%) JNCIS
4 1 (3.85%) Master's Degree
Quality Assurance & Compliance
1 3 (11.54%) PMO
2 2 (7.69%) ISO/IEC 27001
2 2 (7.69%) ISO/IEC 27002 (supersedes ISO/IEC 17799)
3 1 (3.85%) Accessibility
3 1 (3.85%) GDPR
3 1 (3.85%) GRC
3 1 (3.85%) QA
3 1 (3.85%) SLA
3 1 (3.85%) WCAG
System Software
1 4 (15.38%) Active Directory
2 2 (7.69%) Docker
2 2 (7.69%) Virtual Machines
2 2 (7.69%) VMware Infrastructure
Systems Management
1 2 (7.69%) Ansible
1 2 (7.69%) Istio
1 2 (7.69%) Kubernetes
1 2 (7.69%) Puppet
1 2 (7.69%) SCCM
1 2 (7.69%) Terraform
Vendors
1 7 (26.92%) Microsoft
2 4 (15.38%) Cisco
3 3 (11.54%) Arista
3 3 (11.54%) ServiceNow
4 2 (7.69%) Google
4 2 (7.69%) MuleSoft
4 2 (7.69%) Polycom
4 2 (7.69%) Rockwell
4 2 (7.69%) SAP
4 2 (7.69%) Splunk
4 2 (7.69%) VMware
5 1 (3.85%) Ariba
5 1 (3.85%) Citrix
5 1 (3.85%) Dell
5 1 (3.85%) Juniper
5 1 (3.85%) Salesforce