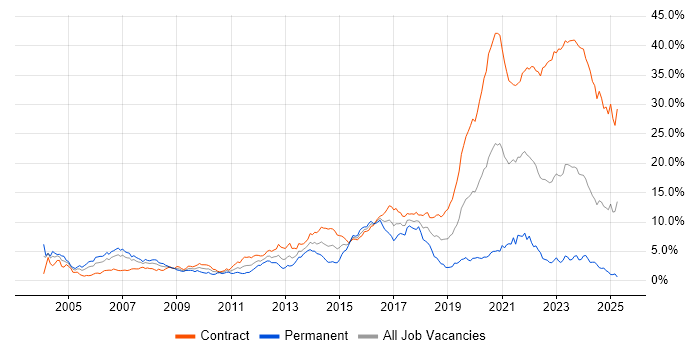
Public Sector Contracts in Edinburgh

Public Sector
Scotland > Edinburgh

The table below looks at the prevalence of the term Public Sector in contract job vacancies in Edinburgh. Included is a benchmarking guide to the contractor rates offered in vacancies that cited Public Sector over the 6 months leading up to 30 June 2025, comparing them to the same period in the previous two years.

6 months to
30 Jun 2025
Same period 2024 Same period 2023
Rank 3 1 1
Rank change year-on-year -2 0 +1
Contract jobs citing Public Sector 183 319 491
As % of all contract jobs advertised in Edinburgh 27.90% 37.35% 41.57%
As % of the General category 35.60% 53.52% 56.24%
Number of daily rates quoted 124 194 378
10th Percentile £190 £156 £243
25th Percentile £330 £281 £401
Median daily rate (50th Percentile) £450 £450 £465
Median % change year-on-year - -3.12% +0.11%
75th Percentile £500 £538 £525
90th Percentile £574 £659 £588
Scotland median daily rate £450 £450 £465
% change year-on-year - -3.23% +0.22%
Number of hourly rates quoted 4 10 0
10th Percentile £20.38 £12.00 -
25th Percentile £23.13 £13.22 -
Median hourly rate £26.01 £14.75 -
Median % change year-on-year +76.31% - -
75th Percentile £32.73 £18.56 -
90th Percentile £40.57 £18.79 -
Scotland median hourly rate £22.08 £16.25 £15.36
% change year-on-year +35.88% +5.83% -39.78%

All General Skills
Edinburgh

Public Sector falls under the General Skills category. For comparison with the information above, the following table provides summary statistics for all contract job vacancies requiring common skills in Edinburgh.

Contract vacancies with a requirement for common skills 514 596 873
As % of all contract IT jobs advertised in Edinburgh 78.35% 69.79% 73.92%
Number of daily rates quoted 260 325 604
10th Percentile £205 £156 £233
25th Percentile £400 £340 £405
Median daily rate (50th Percentile) £471 £450 £475
Median % change year-on-year +4.56% -5.26% -
75th Percentile £534 £550 £545
90th Percentile £600 £655 £600
Scotland median daily rate £463 £450 £475
% change year-on-year +2.89% -5.26% +0.48%
Number of hourly rates quoted 11 33 5
10th Percentile £16.55 £13.22 -
25th Percentile £19.77 £16.25 £17.72
Median hourly rate £22.00 £18.27 £21.26
Median % change year-on-year +20.42% -14.06% -18.23%
75th Percentile £31.34 £60.75 £21.67
90th Percentile £45.80 - £33.27
Scotland median hourly rate £20.00 £18.00 £18.84
% change year-on-year +11.11% -4.46% -46.17%

Public Sector
Job Vacancy Trend in Edinburgh

Job postings citing Public Sector as a proportion of all IT jobs advertised in Edinburgh.

Job vacancy trend for Public Sector in Edinburgh

Public Sector
Contractor Daily Rate Trend in Edinburgh

3-month moving average daily rate quoted in jobs citing Public Sector in Edinburgh.

Daily rate trend for Public Sector in Edinburgh

Public Sector
Daily Rate Histogram in Edinburgh

Daily rate distribution for jobs citing Public Sector in Edinburgh over the 6 months to 30 June 2025.

Daily rate histogram for Public Sector in Edinburgh

Public Sector
Contractor Hourly Rate Trend in Edinburgh

3-month moving average hourly rates quoted in jobs citing Public Sector in Edinburgh.

Hourly rate trend for Public Sector in Edinburgh

Public Sector
Hourly Rate Histogram in Edinburgh

Hourly rate distribution of jobs citing Public Sector in Edinburgh over the 6 months to 30 June 2025.

Hourly rate histogram for Public Sector in Edinburgh

Public Sector
Co-occurring Skills and Capabilities in Edinburgh by Category

The follow tables expand on the table above by listing co-occurrences grouped by category. The same employment type, locality and period is covered with up to 20 co-occurrences shown in each of the following categories:

Application Platforms
1 9 (4.92%) SharePoint
2 7 (3.83%) Confluence
3 2 (1.09%) GeoServer
3 2 (1.09%) IIS
3 2 (1.09%) WordPress
4 1 (0.55%) Apache
4 1 (0.55%) CMS
4 1 (0.55%) Drupal
4 1 (0.55%) Microsoft Exchange
4 1 (0.55%) nginx
4 1 (0.55%) Oracle SOA Suite
4 1 (0.55%) Tomcat
4 1 (0.55%) TPMS
Applications
1 12 (6.56%) Microsoft Excel
2 6 (3.28%) Microsoft Office
3 5 (2.73%) MS Visio
4 4 (2.19%) Oracle Smart View
5 3 (1.64%) Microsoft PowerPoint
6 2 (1.09%) Microsoft Project
7 1 (0.55%) InfoPath
Business Applications
1 3 (1.64%) Dynamics CRM
1 3 (1.64%) Dynamics GP
2 1 (0.55%) Oracle ERP
2 1 (0.55%) Oracle Payables
Cloud Services
1 30 (16.39%) Azure
2 27 (14.75%) AWS
3 19 (10.38%) Amazon S3
4 18 (9.84%) Azure DevOps
4 18 (9.84%) Microsoft 365
5 16 (8.74%) AWS Lambda
5 16 (8.74%) Power Platform
5 16 (8.74%) Serverless
6 11 (6.01%) AWS CloudFormation
7 8 (4.37%) SaaS
8 7 (3.83%) Power Automate
8 7 (3.83%) PowerApps
9 5 (2.73%) Amazon EC2
10 4 (2.19%) Amazon SQS
10 4 (2.19%) IaaS
10 4 (2.19%) OCI
10 4 (2.19%) PaaS
11 3 (1.64%) Azure AI
11 3 (1.64%) Azure Cognitive Search
11 3 (1.64%) Microsoft Copilot
Communications & Networking
1 9 (4.92%) Firewall
2 5 (2.73%) SD-WAN
3 4 (2.19%) LAN
3 4 (2.19%) WAN
3 4 (2.19%) Wi-Fi
4 3 (1.64%) Cisco Nexus
4 3 (1.64%) IPsec
4 3 (1.64%) Unified Communications
4 3 (1.64%) VPN
5 2 (1.09%) 4G
6 1 (0.55%) Internet
6 1 (0.55%) Intranet
6 1 (0.55%) Network Security
6 1 (0.55%) Remote Desktop
6 1 (0.55%) SSL
6 1 (0.55%) WLAN
Database & Business Intelligence
1 14 (7.65%) PostgreSQL
2 9 (4.92%) Amazon Aurora
2 9 (4.92%) Data Warehouse
3 8 (4.37%) Amazon RDS
3 8 (4.37%) Oracle Database
4 7 (3.83%) Power Query
5 6 (3.28%) Power BI
6 4 (2.19%) GIS
6 4 (2.19%) Metadata
6 4 (2.19%) Oracle Reports
7 3 (1.64%) Amazon Redshift
7 3 (1.64%) Azure SQL Database
7 3 (1.64%) MariaDB
7 3 (1.64%) MongoDB
7 3 (1.64%) MySQL
7 3 (1.64%) Redis
8 2 (1.09%) Oracle BI Publisher
8 2 (1.09%) Tableau
9 1 (0.55%) Relational Database
9 1 (0.55%) SQL Server
Development Applications
1 10 (5.46%) JIRA
2 9 (4.92%) Cypress.io
3 7 (3.83%) Jenkins
4 6 (3.28%) Git
5 2 (1.09%) Cucumber
5 2 (1.09%) Postman
5 2 (1.09%) Selenium
5 2 (1.09%) Subversion
5 2 (1.09%) TeamCity
5 2 (1.09%) WebDriver
6 1 (0.55%) Oracle APEX
6 1 (0.55%) RStudio
6 1 (0.55%) TestRail
6 1 (0.55%) Tricentis qTest
General
1 46 (25.14%) Social Skills
2 35 (19.13%) Finance
3 18 (9.84%) Analytical Skills
4 11 (6.01%) Influencing Skills
5 8 (4.37%) Marketing
6 7 (3.83%) Electronics
6 7 (3.83%) Manufacturing
6 7 (3.83%) Telecoms
7 6 (3.28%) Organisational Skills
8 5 (2.73%) Publishing
9 4 (2.19%) Legal
10 1 (0.55%) Back Office
10 1 (0.55%) Digital Health
10 1 (0.55%) Documentation Skills
10 1 (0.55%) Law
10 1 (0.55%) Retail
Job Titles
1 28 (15.30%) Analyst
2 22 (12.02%) Developer
3 17 (9.29%) Business Analyst
4 15 (8.20%) Senior
5 12 (6.56%) Architect
6 9 (4.92%) IT Engineer
7 8 (4.37%) Designer
7 8 (4.37%) Lead
7 8 (4.37%) Programme Manager
7 8 (4.37%) Project Manager
8 7 (3.83%) Deployment Engineer
8 7 (3.83%) RF Engineer
8 7 (3.83%) Senior Analyst
8 7 (3.83%) Senior Business Analyst
9 6 (3.28%) .NET Developer
9 6 (3.28%) Support Officer
10 5 (2.73%) Content Designer
10 5 (2.73%) Solutions Architect
10 5 (2.73%) Technical Leader
11 4 (2.19%) Consultant
Libraries, Frameworks & Software Standards
1 18 (9.84%) React
2 14 (7.65%) .NET
3 12 (6.56%) AWS CDK
4 9 (4.92%) Spring Boot
5 7 (3.83%) CSS
5 7 (3.83%) HTML
5 7 (3.83%) Node.js
5 7 (3.83%) REST
5 7 (3.83%) RESTful
6 6 (3.28%) Oracle Fusion
6 6 (3.28%) Spring
7 5 (2.73%) Middleware
7 5 (2.73%) Next.js
8 4 (2.19%) JSON
8 4 (2.19%) PostGIS
9 3 (1.64%) .NET Framework
9 3 (1.64%) ActiveMQ
9 3 (1.64%) Ajax
9 3 (1.64%) Web Services
9 3 (1.64%) YAML
Miscellaneous
1 12 (6.56%) Management Information System
1 12 (6.56%) Product Ownership
2 7 (3.83%) Cloud Native
3 5 (2.73%) Legacy Systems
4 4 (2.19%) Cyber Threat
4 4 (2.19%) Legacy Applications
4 4 (2.19%) Low-Code
4 4 (2.19%) Mobile App
4 4 (2.19%) PKI
4 4 (2.19%) Self-Motivation
4 4 (2.19%) Wiki
5 3 (1.64%) Linux Command Line
6 2 (1.09%) Client/Server
6 2 (1.09%) Data Centre
6 2 (1.09%) Freedom of Information
6 2 (1.09%) Hybrid Cloud
6 2 (1.09%) Onboarding
6 2 (1.09%) Oracle Licensing
6 2 (1.09%) Replication
6 2 (1.09%) Social Media
Operating Systems
1 16 (8.74%) Windows
2 10 (5.46%) Linux
3 5 (2.73%) Windows Server
4 4 (2.19%) Ubuntu
5 3 (1.64%) AIX
5 3 (1.64%) Apple iOS
5 3 (1.64%) Unix
6 2 (1.09%) Solaris
7 1 (0.55%) Android
7 1 (0.55%) Red Hat Enterprise Linux
7 1 (0.55%) Windows Server 2012
7 1 (0.55%) Windows Server 2016
7 1 (0.55%) Windows Server 2019
Processes & Methodologies
1 63 (34.43%) Agile
2 30 (16.39%) Project Management
3 27 (14.75%) DevOps
4 22 (12.02%) Problem-Solving
5 20 (10.93%) User Experience
6 19 (10.38%) Roadmaps
7 17 (9.29%) User Research
8 16 (8.74%) Analytics
8 16 (8.74%) Mentoring
9 15 (8.20%) Business Intelligence
9 15 (8.20%) CI/CD
9 15 (8.20%) Continuous Improvement
10 14 (7.65%) Infrastructure as Code
11 13 (7.10%) Coaching
11 13 (7.10%) ITIL
11 13 (7.10%) Service Design
11 13 (7.10%) Stakeholder Management
12 12 (6.56%) Cybersecurity
12 12 (6.56%) Kanban
13 11 (6.01%) TDD
Programming Languages
1 18 (9.84%) Java
1 18 (9.84%) JavaScript
2 15 (8.20%) SQL
3 12 (6.56%) Python
4 10 (5.46%) TypeScript
5 8 (4.37%) C#
5 8 (4.37%) PowerShell
6 6 (3.28%) VBA
7 4 (2.19%) Bash
7 4 (2.19%) PL/SQL
8 3 (1.64%) Bicep
8 3 (1.64%) Data Analysis Expressions
8 3 (1.64%) Shell Script
9 2 (1.09%) C++
9 2 (1.09%) Objective-C
9 2 (1.09%) Swift
9 2 (1.09%) VBScript
10 1 (0.55%) R
10 1 (0.55%) VB
10 1 (0.55%) VB6
Qualifications
1 33 (18.03%) Degree
2 22 (12.02%) Security Cleared
3 14 (7.65%) SC Cleared
4 7 (3.83%) AWS Certification
5 6 (3.28%) Computer Science Degree
6 5 (2.73%) IIBA
7 4 (2.19%) AWS Certified Solutions Architect
7 4 (2.19%) CIMA
7 4 (2.19%) Master's Degree
7 4 (2.19%) Postgraduate
8 3 (1.64%) BPSS Clearance
8 3 (1.64%) ITIL Certification
8 3 (1.64%) Microsoft Certification
9 2 (1.09%) CCNA
9 2 (1.09%) Cisco Certification
9 2 (1.09%) ISEB
9 2 (1.09%) ISTQB
9 2 (1.09%) ISTQB Foundation Certification
9 2 (1.09%) MCSE
10 1 (0.55%) HND
Quality Assurance & Compliance
1 15 (8.20%) Accessibility
2 14 (7.65%) Disclosure Scotland
3 7 (3.83%) Data Quality
4 6 (3.28%) GDPR
4 6 (3.28%) QA
5 5 (2.73%) NCSC
6 3 (1.64%) PMO
6 3 (1.64%) WCAG
7 2 (1.09%) PERC
8 1 (0.55%) Actionable Recommendations
8 1 (0.55%) P3O
System Software
1 7 (3.83%) Active Directory
2 4 (2.19%) Hyper-V
3 2 (1.09%) Oracle RAC
4 1 (0.55%) BitLocker
4 1 (0.55%) Docker
4 1 (0.55%) Terminal Services
4 1 (0.55%) VMware Infrastructure
Systems Management
1 11 (6.01%) SCCM
2 9 (4.92%) Microsoft Intune
3 8 (4.37%) Grafana
4 5 (2.73%) Terraform
5 3 (1.64%) Ansible
5 3 (1.64%) Progress Chef
5 3 (1.64%) Prometheus
6 2 (1.09%) Oracle RMAN
7 1 (0.55%) FortiGate
7 1 (0.55%) Kubernetes
Vendors
1 29 (15.85%) Microsoft
2 25 (13.66%) Oracle
3 7 (3.83%) HP
3 7 (3.83%) SAP
4 6 (3.28%) ServiceNow
5 4 (2.19%) Cisco
6 3 (1.64%) Dell
6 3 (1.64%) F5
6 3 (1.64%) Fortinet
6 3 (1.64%) OpenAI
6 3 (1.64%) Palo Alto
6 3 (1.64%) VMware
7 2 (1.09%) BT
7 2 (1.09%) Google
7 2 (1.09%) Snow
8 1 (0.55%) Avaya
8 1 (0.55%) Commvault
8 1 (0.55%) Mitel
8 1 (0.55%) Progress
8 1 (0.55%) Salesforce