Threat Analysis
UK > England
The table below provides summary statistics and contractor rates for jobs advertised in England requiring Threat Analysis skills. It covers vacancies from the 6 months leading up to 19 September 2025, with comparisons to the same periods in the previous two years.
| 6 months to 19 Sep 2025 |
Same period 2024 | Same period 2023 | |
|---|---|---|---|
| Rank | 490 | 502 | 582 |
| Rank change year-on-year | +12 | +80 | +155 |
| Contract jobs citing Threat Analysis | 29 | 24 | 21 |
| As % of all contract jobs advertised in England | 0.10% | 0.073% | 0.050% |
| As % of the Processes & Methodologies category | 0.11% | 0.085% | 0.056% |
| Number of daily rates quoted | 18 | 19 | 20 |
| 10th Percentile | £435 | £351 | £481 |
| 25th Percentile | £463 | £469 | £559 |
| Median daily rate (50th Percentile) | £488 | £550 | £706 |
| Median % change year-on-year | -11.36% | -22.12% | -5.83% |
| 75th Percentile | £559 | £606 | £788 |
| 90th Percentile | £601 | £640 | £853 |
| UK median daily rate | £500 | £550 | £706 |
| % change year-on-year | -9.09% | -22.12% | -2.59% |
| Number of hourly rates quoted | 0 | 1 | 0 |
| Median hourly rate | - | £72.50 | - |
| UK median hourly rate | - | £72.50 | £70.00 |
| % change year-on-year | - | +3.57% | - |
All Process and Methodology Skills
England
Threat Analysis falls under the Processes and Methodologies category. For comparison with the information above, the following table provides summary statistics for all contract job vacancies requiring process or methodology skills in England.
| Contract vacancies with a requirement for process or methodology skills | 25,277 | 28,358 | 37,638 |
| As % of all contract IT jobs advertised in England | 90.89% | 86.07% | 89.13% |
| Number of daily rates quoted | 16,059 | 17,631 | 26,012 |
| 10th Percentile | £300 | £313 | £315 |
| 25th Percentile | £405 | £420 | £428 |
| Median daily rate (50th Percentile) | £510 | £525 | £550 |
| Median % change year-on-year | -2.86% | -4.55% | - |
| 75th Percentile | £625 | £645 | £656 |
| 90th Percentile | £738 | £750 | £750 |
| UK median daily rate | £500 | £525 | £540 |
| % change year-on-year | -4.76% | -2.78% | -1.82% |
| Number of hourly rates quoted | 1,509 | 1,303 | 1,436 |
| 10th Percentile | £14.38 | £15.00 | £14.25 |
| 25th Percentile | £17.79 | £20.00 | £19.00 |
| Median hourly rate | £25.15 | £43.00 | £44.50 |
| Median % change year-on-year | -41.51% | -3.37% | +53.66% |
| 75th Percentile | £50.00 | £66.55 | £65.00 |
| 90th Percentile | £68.00 | £75.00 | £77.50 |
| UK median hourly rate | £25.15 | £43.00 | £43.79 |
| % change year-on-year | -41.51% | -1.81% | +51.53% |
Threat Analysis
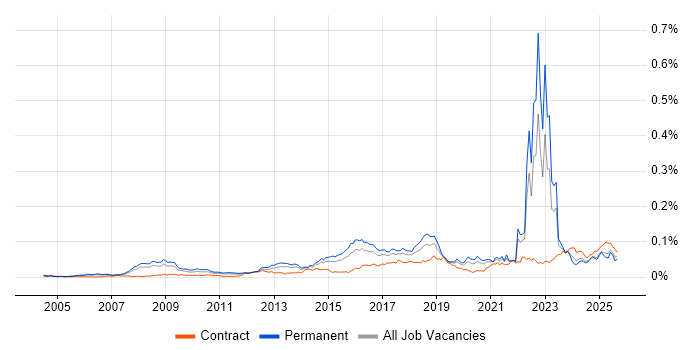
Job Vacancy Trend in England
Job postings citing Threat Analysis as a proportion of all IT jobs advertised in England.

Threat Analysis
Daily Rate Trend in England
Contractor daily rate distribution trend for jobs in England citing Threat Analysis.

Threat Analysis
Daily Rate Histogram in England
Daily rate distribution for jobs citing Threat Analysis in England over the 6 months to 19 September 2025.
Threat Analysis
Hourly Rate Trend in England
Contractor hourly rate distribution trend for jobs in England citing Threat Analysis.

Threat Analysis
Contract Job Locations in England
The table below looks at the demand and provides a guide to the median contractor rates quoted in IT jobs citing Threat Analysis within the England region over the 6 months to 19 September 2025. The 'Rank Change' column provides an indication of the change in demand within each location based on the same 6 month period last year.
| Location | Rank Change on Same Period Last Year |
Matching Contract IT Job Ads |
Median Daily Rate Past 6 Months |
Median Daily Rate % Change on Same Period Last Year |
Live Jobs |
|---|---|---|---|---|---|
| South East | - | 12 | £475 | - | 3 |
| London | -10 | 6 | £475 | -13.64% | 1 |
| South West | - | 5 | £550 | - | 3 |
| North of England | -24 | 3 | £650 | +4.00% | 6 |
| North West | -7 | 2 | - | - | 4 |
| Yorkshire | - | 1 | £650 | - | 2 |
| Threat Analysis UK |
|||||
Threat Analysis
Co-occurring Skills and Capabilities in England by Category
The follow tables expand on the table above by listing co-occurrences grouped by category. The same employment type, locality and period is covered with up to 20 co-occurrences shown in each of the following categories:
