MATLAB Contracts in London

MathWorks MATLAB
England > London

The following table provides summary statistics for contract job vacancies advertised in London with a requirement for MATLAB skills. Included is a benchmarking guide to the contractor rates offered in vacancies that have cited MATLAB over the 6 months to 29 April 2024 with a comparison to the same period in the previous 2 years.

6 months to
29 Apr 2024
Same period 2023 Same period 2022
Rank 367 456 562
Rank change year-on-year +89 +106 -100
Contract jobs citing MATLAB 24 42 39
As % of all contract jobs advertised in London 0.13% 0.16% 0.10%
As % of the Programming Languages category 0.37% 0.38% 0.24%
Number of daily rates quoted 14 29 29
10th Percentile £325 £490 £486
25th Percentile £413 £525 £525
Median daily rate (50th Percentile) £530 £650 £675
Median % change year-on-year -18.46% -3.70% +8.00%
75th Percentile £825 £875 £713
90th Percentile £1,106 £916 £724
England median daily rate £550 £550 £600
% change year-on-year - -8.33% -8.40%
Number of hourly rates quoted 6 3 4
10th Percentile - - £33.63
25th Percentile £52.50 - £35.31
Median hourly rate £55.00 £75.00 £37.50
Median % change year-on-year -26.67% +100.00% -
75th Percentile £57.50 - £40.94
90th Percentile £61.25 - £44.88
England median hourly rate £55.00 £65.00 £60.00
% change year-on-year -15.38% +8.33% +31.15%

All Programming Languages
London

MATLAB is in the Programming Languages category. The following table is for comparison with the above and provides summary statistics for all contract job vacancies advertised in London with a requirement for coding skills.

Contract vacancies with a requirement for coding skills 6,421 11,023 16,342
As % of all contract IT jobs advertised in London 35.99% 40.78% 41.99%
Number of daily rates quoted 4,902 8,207 12,498
10th Percentile £380 £413 £417
25th Percentile £463 £500 £500
Median daily rate (50th Percentile) £575 £600 £600
Median % change year-on-year -4.17% - +14.29%
75th Percentile £700 £738 £700
90th Percentile £825 £825 £800
England median daily rate £540 £565 £550
% change year-on-year -4.42% +2.73% +10.00%
Number of hourly rates quoted 56 85 116
10th Percentile £23.80 £34.55 £28.00
25th Percentile £35.19 £49.25 £35.00
Median hourly rate £50.25 £57.50 £50.00
Median % change year-on-year -12.61% +15.00% +11.11%
75th Percentile £61.94 £75.00 £67.50
90th Percentile £70.94 £83.45 £79.13
England median hourly rate £62.50 £61.84 £50.00
% change year-on-year +1.07% +23.68% +14.94%

MATLAB
Job Vacancy Trend in London

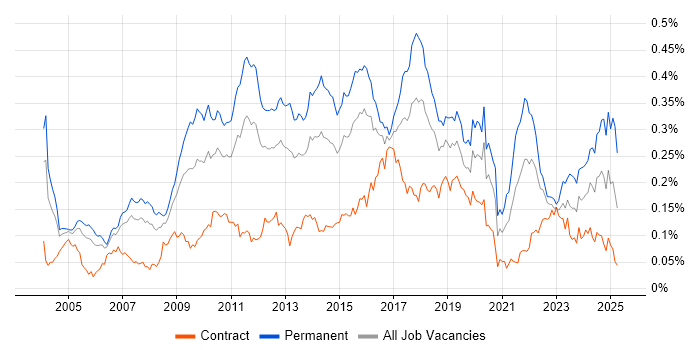
Job postings citing MATLAB as a proportion of all IT jobs advertised in London.

Job vacancy trend for MATLAB in London

MATLAB
Contractor Daily Rate Trend in London

3-month moving average daily rate quoted in jobs citing MATLAB in London.

Daily rate trend for MATLAB in London

MATLAB
Daily Rate Histogram in London

Daily rate distribution for jobs citing MATLAB in London over the 6 months to 29 April 2024.

Daily rate histogram for MATLAB in London

MATLAB
Contractor Hourly Rate Trend in London

3-month moving average hourly rates quoted in jobs citing MATLAB in London.

Hourly rate trend for MATLAB in London

MATLAB
Contract Job Locations in London

The table below looks at the demand and provides a guide to the median contractor rates quoted in IT jobs citing MATLAB within the London region over the 6 months to 29 April 2024. The 'Rank Change' column provides an indication of the change in demand within each location based on the same 6 month period last year.

Location Rank Change
on Same Period
Last Year
Matching
Contract
IT Job Ads
Median
Daily Rate
Past 6 Months
Median Daily Rate
% Change
on Same Period
Last Year
Live
Jobs
Central London +38 2 - - 4
East London - 2 £460 - 1
West London +14 1 £650 -
MATLAB
England

MATLAB
Co-occurring Skills and Capabilities in London by Category

The follow tables expand on the table above by listing co-occurrences grouped by category. The same employment type, locality and period is covered with up to 20 co-occurrences shown in each of the following categories:

Applications
1 11 (45.83%) Simulink
2 7 (29.17%) Stateflow
3 2 (8.33%) MS Visio
Cloud Services
1 9 (37.50%) Power Platform
2 5 (20.83%) Microsoft Purview
2 5 (20.83%) Power Automate
2 5 (20.83%) PowerApps
3 2 (8.33%) GCP
3 2 (8.33%) Google Analytics
4 1 (4.17%) AWS
4 1 (4.17%) Firebase
Database & Business Intelligence
1 9 (37.50%) Power BI
2 5 (20.83%) Metadata
2 5 (20.83%) SQL Server
3 2 (8.33%) BigQuery
3 2 (8.33%) Looker
3 2 (8.33%) Tableau
Development Applications
1 1 (4.17%) Git
1 1 (4.17%) JIRA
1 1 (4.17%) Xcode
General
1 7 (29.17%) Finance
2 6 (25.00%) Automotive
2 6 (25.00%) Legal
2 6 (25.00%) Social Skills
3 4 (16.67%) Banking
4 2 (8.33%) Aerospace
4 2 (8.33%) Marketing
5 1 (4.17%) Military
Job Titles
1 10 (41.67%) Developer
2 6 (25.00%) Software Engineer
3 5 (20.83%) Automation Developer
3 5 (20.83%) Business Intelligence Developer
3 5 (20.83%) Power BI Developer
4 3 (12.50%) Applications Developer
4 3 (12.50%) Power Apps Developer
4 3 (12.50%) Python Developer
5 2 (8.33%) Analyst
5 2 (8.33%) Credit Analyst
5 2 (8.33%) Data Scientist
5 2 (8.33%) Research Analyst
5 2 (8.33%) Senior
5 2 (8.33%) Senior Analyst
5 2 (8.33%) Senior Research Analyst
6 1 (4.17%) Algorithm Engineer
6 1 (4.17%) Full Stack Developer
6 1 (4.17%) Lead
6 1 (4.17%) Lead Full Stack Developer
6 1 (4.17%) Lead iOS Developer
Libraries, Frameworks & Software Standards
1 2 (8.33%) NumPy
2 1 (4.17%) AVFoundation
2 1 (4.17%) COM
2 1 (4.17%) iOS SDK
2 1 (4.17%) OpenAPI
2 1 (4.17%) Protocol Buffers
2 1 (4.17%) PyTorch
2 1 (4.17%) Spring
2 1 (4.17%) Spring Boot
2 1 (4.17%) Swagger
2 1 (4.17%) SwiftUI
2 1 (4.17%) TensorFlow
Miscellaneous
1 8 (33.33%) Algorithms
2 2 (8.33%) Credit Risk
2 2 (8.33%) Reference Data
3 1 (4.17%) Mobile App
3 1 (4.17%) Robotics
Operating Systems
1 1 (4.17%) Apple iOS
Processes & Methodologies
1 8 (33.33%) Computer Science
1 8 (33.33%) Software Engineering
1 8 (33.33%) Validation
1 8 (33.33%) Verification and Validation
2 7 (29.17%) Business Intelligence
2 7 (29.17%) Data Science
2 7 (29.17%) Data Visualisation
2 7 (29.17%) Visualisation
3 6 (25.00%) Hardware-in-the-Loop
3 6 (25.00%) Test Automation
4 5 (20.83%) Analytics
4 5 (20.83%) Data Analysis
4 5 (20.83%) Data Governance
5 3 (12.50%) Data-Driven Decision Making
5 3 (12.50%) Decision-Making
5 3 (12.50%) Machine Learning
6 2 (8.33%) Actionable Insight
6 2 (8.33%) Business Case
6 2 (8.33%) Coaching
6 2 (8.33%) Data Transformation
Programming Languages
1 10 (41.67%) Python
2 8 (33.33%) SQL
3 4 (16.67%) C++
4 2 (8.33%) JavaScript
4 2 (8.33%) R
4 2 (8.33%) VBA
5 1 (4.17%) C
5 1 (4.17%) Java
5 1 (4.17%) Swift
Qualifications
1 6 (25.00%) Degree
2 4 (16.67%) Master's Degree
3 3 (12.50%) SC Cleared
3 3 (12.50%) Security Cleared
4 2 (8.33%) CFA
4 2 (8.33%) Computer Science Degree
4 2 (8.33%) MBA
4 2 (8.33%) Postgraduate
System Software
1 2 (8.33%) Docker
Vendors
1 5 (20.83%) Databricks
2 2 (8.33%) Google
2 2 (8.33%) Salesforce
3 1 (4.17%) Microsoft
3 1 (4.17%) OpenAI