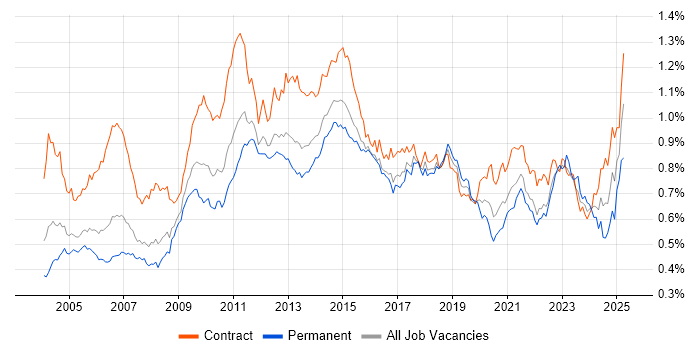
Documentation Skills Contract Job Trends in London

Documentation Skills
England > London

The table below looks at the prevalence of the term Documentation Skills in contract job vacancies in London. Included is a benchmarking guide to the contractor rates offered in vacancies that cited Documentation Skills over the 6 months leading up to 19 September 2025, comparing them to the same period in the previous two years.

6 months to
19 Sep 2025
Same period 2024 Same period 2023
Rank 163 250 314
Rank change year-on-year +87 +64 +8
Contract jobs citing Documentation Skills 232 129 140
As % of all contract jobs advertised in London 1.72% 0.79% 0.64%
As % of the General category 2.49% 1.27% 0.99%
Number of daily rates quoted 135 71 94
10th Percentile £375 £350 £350
25th Percentile £424 £463 £400
Median daily rate (50th Percentile) £501 £575 £500
Median % change year-on-year -12.96% +15.00% -8.88%
75th Percentile £638 £638 £584
90th Percentile £775 £699 £650
England median daily rate £500 £531 £500
% change year-on-year -5.88% +6.25% -4.76%
Number of hourly rates quoted 3 0 0
10th Percentile £21.34 - -
25th Percentile £24.59 - -
Median hourly rate £30.00 - -
75th Percentile £47.79 - -
90th Percentile £58.46 - -
England median hourly rate £42.50 £31.25 £62.00
% change year-on-year +36.00% -49.60% +12.73%

All General Skills
London

Documentation Skills falls under the General Skills category. For comparison with the information above, the following table provides summary statistics for all contract job vacancies requiring common skills in London.

Contract vacancies with a requirement for common skills 9,314 10,133 14,121
As % of all contract IT jobs advertised in London 69.16% 62.15% 64.43%
Number of daily rates quoted 6,144 6,716 10,317
10th Percentile £325 £330 £363
25th Percentile £425 £450 £475
Median daily rate (50th Percentile) £550 £575 £600
Median % change year-on-year -4.35% -4.17% -
75th Percentile £675 £700 £700
90th Percentile £788 £825 £810
England median daily rate £500 £538 £550
% change year-on-year -6.98% -2.27% -
Number of hourly rates quoted 183 121 177
10th Percentile £17.00 £18.00 £17.99
25th Percentile £24.64 £25.00 £19.99
Median hourly rate £32.50 £35.00 £28.50
Median % change year-on-year -7.14% +22.81% -19.72%
75th Percentile £49.75 £53.75 £54.50
90th Percentile £65.00 £66.00 £70.00
England median hourly rate £25.15 £38.50 £29.75
% change year-on-year -34.68% +29.41% +20.01%

Documentation Skills
Job Vacancy Trend in London

Job postings citing Documentation Skills as a proportion of all IT jobs advertised in London.

Job vacancy trend for Documentation Skills in London

Documentation Skills
Daily Rate Trend in London

Contractor daily rate distribution trend for jobs in London citing Documentation Skills.

Contractor daily rate distribution trend for jobs in London citing Documentation Skills

Documentation Skills
Daily Rate Histogram in London

Daily rate distribution for jobs citing Documentation Skills in London over the 6 months to 19 September 2025.

Daily rate histogram for Documentation Skills in London

Documentation Skills
Hourly Rate Trend in London

Contractor hourly rate distribution trend for jobs in London citing Documentation Skills.

Contractor hourly rate distribution trend for jobs in London citing Documentation Skills

Documentation Skills
Hourly Rate Histogram in London

Hourly rate distribution of jobs citing Documentation Skills in London over the 6 months to 19 September 2025.

Hourly rate histogram for Documentation Skills in London

Documentation Skills
Contract Job Locations in London

The table below looks at the demand and provides a guide to the median contractor rates quoted in IT jobs citing Documentation Skills within the London region over the 6 months to 19 September 2025. The 'Rank Change' column provides an indication of the change in demand within each location based on the same 6 month period last year.

Location Rank Change
on Same Period
Last Year
Matching
Contract
IT Job Ads
Median
Daily Rate
Past 6 Months
Median Daily Rate
% Change
on Same Period
Last Year
Live
Jobs
Central London +24 39 £531 -9.57% 10
South London - 7 £600 -
East London +7 3 £356 -40.63% 2
West London - 2 £425 - 3
Documentation Skills
England

Documentation Skills
Co-occurring Skills and Capabilities in London by Category

The follow tables expand on the table above by listing co-occurrences grouped by category. The same employment type, locality and period is covered with up to 20 co-occurrences shown in each of the following categories:

Application Platforms
1 17 (7.33%) Confluence
2 9 (3.88%) SharePoint
3 4 (1.72%) Apache
4 3 (1.29%) Apache Spark
4 3 (1.29%) Microsoft Exchange
4 3 (1.29%) OpenStack
5 2 (0.86%) Apache Airflow
5 2 (0.86%) Oracle Workflow
6 1 (0.43%) Adobe Experience Manager
6 1 (0.43%) Appian
6 1 (0.43%) Oracle Coherence
Applications
1 14 (6.03%) Microsoft Excel
2 12 (5.17%) MS Visio
3 6 (2.59%) Microsoft Office
3 6 (2.59%) Microsoft PowerPoint
4 3 (1.29%) Microsoft Project
5 1 (0.43%) Spreadsheet
Business Applications
1 4 (1.72%) CA PPM
1 4 (1.72%) Dynamics CRM
1 4 (1.72%) Infor SunSystems
1 4 (1.72%) SAP S/4HANA
2 3 (1.29%) Endur
3 2 (0.86%) Aladdin
3 2 (0.86%) OpenText MBPM
3 2 (0.86%) Oracle BPM
3 2 (0.86%) Oracle EBS
3 2 (0.86%) Oracle Financials
3 2 (0.86%) Oracle Payables
3 2 (0.86%) Oracle Receivables
3 2 (0.86%) Salesforce CRM
4 1 (0.43%) Cerner Millennium
4 1 (0.43%) Elite 3E
4 1 (0.43%) NEC Housing
4 1 (0.43%) Remedy ITSM
4 1 (0.43%) SAP FI
4 1 (0.43%) Unit4 Business World
4 1 (0.43%) Workday HCM
Cloud Services
1 54 (23.28%) Azure
2 40 (17.24%) AWS
3 20 (8.62%) Amazon S3
4 19 (8.19%) SaaS
5 17 (7.33%) Amazon EC2
5 17 (7.33%) Amazon SQS
5 17 (7.33%) Azure DevOps
6 14 (6.03%) Microsoft 365
7 13 (5.60%) Entra ID
7 13 (5.60%) Power Platform
8 12 (5.17%) GCP
8 12 (5.17%) GitHub
9 9 (3.88%) Dynamics 365
10 8 (3.45%) GitHub Actions
11 7 (3.02%) Serverless
12 6 (2.59%) dbt
13 4 (1.72%) Azure Functions
13 4 (1.72%) Azure Key Vault
13 4 (1.72%) Azure Logic Apps
13 4 (1.72%) Azure Monitor
Communications & Networking
1 14 (6.03%) DNS
1 14 (6.03%) Firewall
2 11 (4.74%) VPN
3 10 (4.31%) BGP
3 10 (4.31%) WAN
4 9 (3.88%) OSPF
5 6 (2.59%) Wi-Fi
6 5 (2.16%) DHCP
6 5 (2.16%) LAN
6 5 (2.16%) Network Security
6 5 (2.16%) SD-WAN
7 4 (1.72%) MPLS
7 4 (1.72%) Multicast
7 4 (1.72%) TCP/IP
8 3 (1.29%) Ethernet VPN
8 3 (1.29%) NAS
8 3 (1.29%) VXLAN
9 2 (0.86%) Cisco Nexus
9 2 (0.86%) IGMP
9 2 (0.86%) NetScaler
Database & Business Intelligence
1 12 (5.17%) SQL Server
2 11 (4.74%) Power BI
3 8 (3.45%) Metadata
4 6 (2.59%) Data Warehouse
4 6 (2.59%) Tableau
5 5 (2.16%) Oracle Reports
5 5 (2.16%) SQL Server Reporting Services
6 4 (1.72%) Data Lake
6 4 (1.72%) NoSQL
6 4 (1.72%) SQL Server Integration Services
7 3 (1.29%) Delta Lake
7 3 (1.29%) Oracle Database
8 2 (0.86%) Amazon RDS
8 2 (0.86%) Apache Cassandra
8 2 (0.86%) BusinessObjects
8 2 (0.86%) Crystal Reports
8 2 (0.86%) DynamoDB
8 2 (0.86%) MongoDB
8 2 (0.86%) PostgreSQL
8 2 (0.86%) Relational Database
Development Applications
1 26 (11.21%) JIRA
2 12 (5.17%) Git
3 8 (3.45%) Selenium
4 7 (3.02%) Jenkins
5 5 (2.16%) ERwin
5 5 (2.16%) MLflow
6 4 (1.72%) JUnit
7 3 (1.29%) GitLab
7 3 (1.29%) TestNG
7 3 (1.29%) TestRail
7 3 (1.29%) WebDriver
7 3 (1.29%) Zephyr
8 2 (0.86%) ER Studio
8 2 (0.86%) Sonatype Nexus
8 2 (0.86%) Visual Studio
9 1 (0.43%) Locust
9 1 (0.43%) Postman
9 1 (0.43%) Robot Framework
9 1 (0.43%) SonarQube
9 1 (0.43%) Visual Studio Code
General
1 122 (52.59%) Social Skills
2 73 (31.47%) Finance
3 40 (17.24%) Analytical Skills
4 29 (12.50%) Public Sector
5 25 (10.78%) Banking
6 10 (4.31%) Legal
7 9 (3.88%) Inclusion and Diversity
8 8 (3.45%) Presentation Skills
8 8 (3.45%) Telecoms
9 6 (2.59%) Back Office
10 5 (2.16%) Front Office
10 5 (2.16%) Organisational Skills
10 5 (2.16%) Retail Banking
11 4 (1.72%) Arabic Language
11 4 (1.72%) Czech Language
11 4 (1.72%) Financial Institution
11 4 (1.72%) General Ledger
11 4 (1.72%) Investment Banking
11 4 (1.72%) Law
11 4 (1.72%) Military
Job Titles
1 56 (24.14%) Analyst
2 37 (15.95%) Architect
3 31 (13.36%) Business Analyst
4 22 (9.48%) Security Architect
5 21 (9.05%) Consultant
6 20 (8.62%) Developer
7 16 (6.90%) Senior
8 10 (4.31%) Systems Analyst
9 8 (3.45%) Financial Analyst
9 8 (3.45%) Lead
10 7 (3.02%) Finance Systems Analyst
10 7 (3.02%) Tester
11 6 (2.59%) Network Architect
11 6 (2.59%) Network Engineer
11 6 (2.59%) Senior Architect
12 5 (2.16%) Data Modeller
12 5 (2.16%) DevOps Engineer
12 5 (2.16%) QA Tester
12 5 (2.16%) Senior Analyst
12 5 (2.16%) Solutions Architect
Libraries, Frameworks & Software Standards
1 10 (4.31%) REST
2 9 (3.88%) .NET
3 7 (3.02%) Web Services
4 6 (2.59%) SOAP
5 5 (2.16%) Kafka
5 5 (2.16%) React
5 5 (2.16%) SailPoint
6 4 (1.72%) JSON
7 3 (1.29%) AngularJS
7 3 (1.29%) CSS
7 3 (1.29%) HTML
7 3 (1.29%) Node.js
7 3 (1.29%) OAuth
7 3 (1.29%) SAML
8 2 (0.86%) LDAP
8 2 (0.86%) OpenID
8 2 (0.86%) pytest
8 2 (0.86%) Spring
8 2 (0.86%) Spring Boot
8 2 (0.86%) XML
Miscellaneous
1 25 (10.78%) Onboarding
2 17 (7.33%) CSOC
2 17 (7.33%) Security Operations Centre
3 10 (4.31%) Product Ownership
4 8 (3.45%) Cloud Native
5 7 (3.02%) Data Centre
5 7 (3.02%) Data Structures
5 7 (3.02%) Management Information System
6 6 (2.59%) Public Cloud
7 4 (1.72%) Algorithms
7 4 (1.72%) NHS
7 4 (1.72%) Replication
7 4 (1.72%) Virtual Team
8 3 (1.29%) CMDB
8 3 (1.29%) Hybrid Cloud
8 3 (1.29%) Legacy Systems
8 3 (1.29%) PKI
8 3 (1.29%) Team-Oriented Environment
9 2 (0.86%) Analytical Mindset
9 2 (0.86%) Distributed Systems
Operating Systems
1 21 (9.05%) Windows
2 8 (3.45%) Linux
3 5 (2.16%) Windows Server
4 3 (1.29%) Windows 10
5 1 (0.43%) AIX
5 1 (0.43%) Android
5 1 (0.43%) HPUX
5 1 (0.43%) Red Hat Enterprise Linux
5 1 (0.43%) Solaris
5 1 (0.43%) Unix
5 1 (0.43%) Windows Server 2016
Processes & Methodologies
1 51 (21.98%) Problem-Solving
2 50 (21.55%) Agile
3 43 (18.53%) DevOps
4 32 (13.79%) CI/CD
5 29 (12.50%) Migration
6 27 (11.64%) Cybersecurity
7 26 (11.21%) User Acceptance Testing
8 24 (10.34%) Stakeholder Management
8 24 (10.34%) Use Case
9 23 (9.91%) Validation
10 21 (9.05%) Roadmaps
11 19 (8.19%) Stakeholder Engagement
12 18 (7.76%) Security Operations
12 18 (7.76%) SIEM
13 17 (7.33%) SOAR
14 16 (6.90%) Business Analysis
15 15 (6.47%) Requirements Gathering
15 15 (6.47%) Test Automation
16 14 (6.03%) Data Governance
16 14 (6.03%) Scrum
Programming Languages
1 38 (16.38%) SQL
2 26 (11.21%) Python
3 13 (5.60%) PowerShell
4 12 (5.17%) Java
5 11 (4.74%) C#
6 9 (3.88%) JavaScript
7 5 (2.16%) T-SQL
8 4 (1.72%) PL/SQL
9 3 (1.29%) Bash
9 3 (1.29%) Bicep
9 3 (1.29%) R
9 3 (1.29%) TypeScript
10 2 (0.86%) Go
10 2 (0.86%) MATLAB
11 1 (0.43%) Apex Code
11 1 (0.43%) Data Analysis Expressions
11 1 (0.43%) Perl
11 1 (0.43%) Scala
11 1 (0.43%) VB
11 1 (0.43%) VBA
Qualifications
1 30 (12.93%) Security Cleared
2 29 (12.50%) SC Cleared
3 18 (7.76%) Degree
4 7 (3.02%) ISTQB
4 7 (3.02%) Microsoft Certification
5 5 (2.16%) Computer Science Degree
5 5 (2.16%) Master's Degree
6 4 (1.72%) CCNP
6 4 (1.72%) Cisco Certification
7 3 (1.29%) AWS Certification
7 3 (1.29%) AWS Certified Solutions Architect
7 3 (1.29%) CISSP
7 3 (1.29%) PMI Certification
7 3 (1.29%) PMP
8 2 (0.86%) AWS Certified Developer
8 2 (0.86%) Azure Certification
8 2 (0.86%) BPSS Clearance
8 2 (0.86%) CCIE
8 2 (0.86%) DV Cleared
8 2 (0.86%) JNCIS
Quality Assurance & Compliance
1 12 (5.17%) QA
2 10 (4.31%) NIST
3 7 (3.02%) GDPR
4 6 (2.59%) Data Quality
5 3 (1.29%) Accessibility
5 3 (1.29%) MiFID
5 3 (1.29%) NCSC
6 2 (0.86%) California Consumer Privacy Act
6 2 (0.86%) GRC
6 2 (0.86%) IFRS
6 2 (0.86%) ISO 20022
6 2 (0.86%) ISO/IEC 27001
6 2 (0.86%) PERC
6 2 (0.86%) Solvency II
7 1 (0.43%) Dodd-Frank
7 1 (0.43%) EMIR
7 1 (0.43%) IEC 62304
7 1 (0.43%) IFRS 9
7 1 (0.43%) ISO 13485
7 1 (0.43%) PMO
System Software
1 25 (10.78%) Active Directory
2 7 (3.02%) Docker
3 3 (1.29%) Virtual Desktop
4 2 (0.86%) Microsoft App-V
4 2 (0.86%) Virtual Machines
4 2 (0.86%) VMware Infrastructure
5 1 (0.43%) BitLocker
5 1 (0.43%) Hyper-V
5 1 (0.43%) VMware NSX
Systems Management
1 11 (4.74%) Terraform
2 10 (4.31%) Kubernetes
2 10 (4.31%) Microsoft Intune
3 8 (3.45%) SCCM
4 7 (3.02%) Ansible
5 3 (1.29%) Single Sign-On
6 1 (0.43%) Jamf Pro
6 1 (0.43%) Kibana
6 1 (0.43%) NetBackup
6 1 (0.43%) vRealize
6 1 (0.43%) WSUS
Vendors
1 47 (20.26%) Microsoft
2 18 (7.76%) Splunk
3 15 (6.47%) Salesforce
4 13 (5.60%) Oracle
5 12 (5.17%) Fortinet
5 12 (5.17%) ServiceNow
6 9 (3.88%) Cisco
7 8 (3.45%) SAP
8 7 (3.02%) Databricks
9 6 (2.59%) Guidewire
10 5 (2.16%) Duck Creek
11 4 (1.72%) AlgoSec
11 4 (1.72%) Arista
11 4 (1.72%) Broadcom
11 4 (1.72%) Google
11 4 (1.72%) Tufin
11 4 (1.72%) Workday
12 3 (1.29%) Citrix
12 3 (1.29%) SolarWinds
12 3 (1.29%) VMware