Data Governance Contract Job Trends in London

Data Governance
England > London

The table below provides summary statistics and contractor rates for jobs advertised in London requiring Data Governance skills. It covers contract job vacancies from the 6 months leading up to 20 November 2025, with comparisons to the same periods in the previous two years.

6 months to
20 Nov 2025
Same period 2024 Same period 2023
Rank 67 111 155
Rank change year-on-year +44 +44 +62
Contract jobs citing Data Governance 544 349 319
As % of all contract jobs in London 3.85% 2.22% 1.61%
As % of the Processes & Methodologies category 4.17% 2.49% 1.80%
Number of daily rates quoted 384 243 230
10th Percentile £400 £382 £475
25th Percentile £463 £500 £550
Median daily rate (50th Percentile) £550 £575 £650
Median % change year-on-year -4.35% -11.54% +8.33%
75th Percentile £650 £713 £743
90th Percentile £750 £827 £788
England median daily rate £525 £550 £614
% change year-on-year -4.55% -10.39% +2.29%
Number of hourly rates quoted 6 0 6
10th Percentile - - £29.50
25th Percentile £18.25 - £35.00
Median hourly rate £18.50 - £35.32
75th Percentile £18.75 - £45.72
90th Percentile £28.13 - £49.92
England median hourly rate £18.50 £28.56 £40.84
% change year-on-year -35.23% -30.07% +83.31%

All Process and Methodology Skills
London

Data Governance falls under the Processes and Methodologies category. For comparison with the information above, the following table provides summary statistics for all contract job vacancies requiring process or methodology skills in London.

Contract vacancies with a requirement for process or methodology skills 13,053 14,033 17,744
As % of all contract IT jobs advertised in London 92.33% 89.24% 89.72%
Number of daily rates quoted 8,585 9,054 12,730
10th Percentile £335 £350 £353
25th Percentile £425 £450 £460
Median daily rate (50th Percentile) £537 £550 £568
Median % change year-on-year -2.36% -3.21% -3.69%
75th Percentile £653 £675 £688
90th Percentile £775 £800 £800
England median daily rate £505 £525 £545
% change year-on-year -3.81% -3.67% -0.91%
Number of hourly rates quoted 261 166 246
10th Percentile £17.98 £17.38 £18.68
25th Percentile £24.50 £23.98 £21.56
Median hourly rate £28.13 £37.50 £36.33
Median % change year-on-year -25.00% +3.21% -6.54%
75th Percentile £47.00 £55.56 £61.75
90th Percentile £67.50 £80.38 £76.25
England median hourly rate £25.15 £37.00 £45.00
% change year-on-year -32.03% -17.78% +26.90%

Data Governance
Job Vacancy Trend in London

Historical trend showing the proportion of contract IT job postings citing Data Governance relative to all contract IT jobs advertised in London.
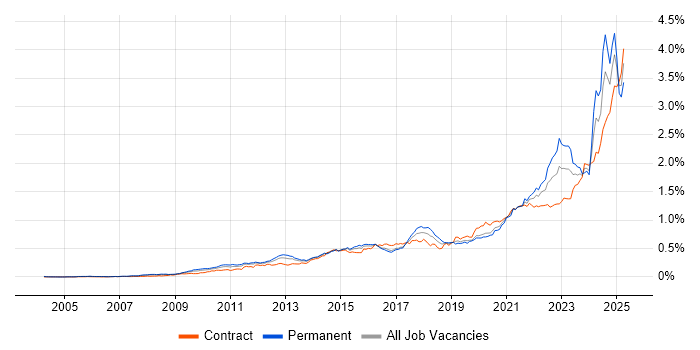
Data Governance job vacancy trend in London

Data Governance
Daily Rate Trend in London

Contractor daily rate distribution trend for jobs in London citing Data Governance.

Contractor daily rate distribution trend for jobs in London citing Data Governance

Data Governance
Daily Rate Histogram in London

Daily rate distribution for jobs citing Data Governance in London over the 6 months to 20 November 2025.

Daily rate histogram for Data Governance in London

Data Governance
Hourly Rate Trend in London

Contractor hourly rate distribution trend for jobs in London citing Data Governance.

Contractor hourly rate distribution trend for jobs in London citing Data Governance

Data Governance
Hourly Rate Histogram in London

Hourly rate distribution of jobs citing Data Governance in London over the 6 months to 20 November 2025.

Hourly rate histogram for Data Governance in London

Data Governance
Contract Job Locations in London

The table below looks at the demand and provides a guide to the median contractor rates quoted in IT jobs citing Data Governance within the London region over the 6 months to 20 November 2025. The 'Rank Change' column provides an indication of the change in demand within each location based on the same 6 month period last year.

Location Rank Change
on Same Period
Last Year
Matching
Contract
IT Job Ads
Median
Daily Rate
Past 6 Months
Median Daily Rate
% Change
on Same Period
Last Year
Live
Jobs
Central London +34 85 £575 -5.93% 166
West London -14 6 £601 +2.34% 11
South London -4 4 £487 -18.79% 3
East London 0 1 £638 +59.38% 9
Data Governance
England

Data Governance
Co-Occurring Skills & Capabilities in London by Category

The following tables expand on the one above by listing co-occurrences grouped by category. They cover the same employment type, locality and period, with up to 20 co-occurrences shown in each category:

Application Platforms
1 52 (9.56%) Apache Spark
2 31 (5.70%) Apache
3 26 (4.78%) Apache Airflow
4 22 (4.04%) Confluence
5 13 (2.39%) SharePoint
6 5 (0.92%) CMS
7 3 (0.55%) Jupyter
8 1 (0.18%) Appian
8 1 (0.18%) Luigi
8 1 (0.18%) Microsoft Exchange
8 1 (0.18%) Oracle Workflow
8 1 (0.18%) SAS
Applications
1 26 (4.78%) Microsoft Excel
2 11 (2.02%) Microsoft PowerPoint
3 9 (1.65%) MS Visio
4 6 (1.10%) Microsoft Project
5 4 (0.74%) Microsoft Office
6 1 (0.18%) Navisworks
6 1 (0.18%) ProjectWise
6 1 (0.18%) Revit
6 1 (0.18%) Trello
Business Applications
1 16 (2.94%) SAP S/4HANA
2 14 (2.57%) Sparx Enterprise Architect
3 10 (1.84%) SAP MDG
4 3 (0.55%) Dynamics CRM
4 3 (0.55%) SAP IBP
5 2 (0.37%) Actimize
5 2 (0.37%) Aladdin
5 2 (0.37%) Distributed Ledger
5 2 (0.37%) Markit EDM
5 2 (0.37%) Oracle EBS
5 2 (0.37%) Salesforce CRM
5 2 (0.37%) SAP Oil and Gas
5 2 (0.37%) Workday HCM
6 1 (0.18%) Integrated Workplace Management System
6 1 (0.18%) NEC Housing
6 1 (0.18%) NetSuite
6 1 (0.18%) SAP CO
6 1 (0.18%) SAP FI
6 1 (0.18%) SAP FI/CO
6 1 (0.18%) Unit4 Business World
Cloud Services
1 212 (38.97%) Azure
2 142 (26.10%) AWS
3 127 (23.35%) Power Platform
4 87 (15.99%) GCP
5 77 (14.15%) Snowflake
6 56 (10.29%) Azure Data Factory
7 45 (8.27%) dbt
8 44 (8.09%) Azure Synapse Analytics
9 36 (6.62%) Microsoft Purview
10 34 (6.25%) Collibra
11 29 (5.33%) Azure DevOps
12 25 (4.60%) Amazon S3
13 21 (3.86%) Serverless
14 20 (3.68%) GitHub
15 16 (2.94%) GitHub Actions
16 15 (2.76%) AWS CloudFormation
16 15 (2.76%) AWS Lambda
16 15 (2.76%) Microsoft 365
17 12 (2.21%) Entra ID
18 10 (1.84%) Power Automate
Communications & Networking
1 4 (0.74%) Cisco IPT
2 1 (0.18%) DKIM
2 1 (0.18%) DMARC
2 1 (0.18%) Firewall
2 1 (0.18%) Hyperconnected
2 1 (0.18%) Network Security
2 1 (0.18%) PSTN
Database & Business Intelligence
1 117 (21.51%) Metadata
2 109 (20.04%) Data Warehouse
2 109 (20.04%) Power BI
3 66 (12.13%) Data Lake
4 34 (6.25%) Big Data
4 34 (6.25%) Tableau
5 33 (6.07%) NoSQL
6 28 (5.15%) SQL Server
7 27 (4.96%) Amazon Redshift
8 23 (4.23%) Relational Database
9 22 (4.04%) Azure SQL Database
9 22 (4.04%) BigQuery
9 22 (4.04%) Delta Lake
10 21 (3.86%) Data Vault
11 20 (3.68%) Snowflake Schema
12 17 (3.13%) PostgreSQL
13 13 (2.39%) Star Schema
14 12 (2.21%) Power Query
14 12 (2.21%) SQL Server Integration Services
15 10 (1.84%) Hadoop
Development Applications
1 42 (7.72%) JIRA
2 30 (5.51%) ERwin
3 22 (4.04%) Git
4 20 (3.68%) PowerDesigner
5 17 (3.13%) ER Studio
6 8 (1.47%) MLflow
7 7 (1.29%) Jenkins
8 4 (0.74%) GitLab
9 2 (0.37%) Browser DevTools
9 2 (0.37%) Charles Proxy
9 2 (0.37%) Fiddler
10 1 (0.18%) Eclipse
10 1 (0.18%) Liquibase
10 1 (0.18%) Postman
10 1 (0.18%) SonarQube
10 1 (0.18%) SQL Server Management Studio (SSMS)
10 1 (0.18%) TeamCity
General
1 228 (41.91%) Social Skills
2 176 (32.35%) Finance
3 109 (20.04%) Analytical Skills
4 62 (11.40%) Public Sector
5 49 (9.01%) Banking
6 29 (5.33%) Legal
7 20 (3.68%) Inclusion and Diversity
8 16 (2.94%) Financial Institution
8 16 (2.94%) Marketing
9 15 (2.76%) Investment Banking
10 14 (2.57%) Retail
11 12 (2.21%) Documentation Skills
11 12 (2.21%) Pharmaceutical
11 12 (2.21%) Presentation Skills
11 12 (2.21%) Publishing
12 9 (1.65%) Organisational Skills
13 7 (1.29%) Electronics
13 7 (1.29%) Manufacturing
14 6 (1.10%) Influencing Skills
14 6 (1.10%) Local Government
Job Titles
1 115 (21.14%) Architect
2 93 (17.10%) Analyst
3 67 (12.32%) Data Engineer
4 63 (11.58%) Data Architect
5 62 (11.40%) Lead
6 50 (9.19%) Data Analyst
7 48 (8.82%) Business Analyst
8 40 (7.35%) Senior
9 37 (6.80%) Data Modeller
10 25 (4.60%) Consultant
11 23 (4.23%) Azure Engineer
12 20 (3.68%) Azure Data Engineer
13 19 (3.49%) Governance Analyst
14 18 (3.31%) Data Business Analyst
15 17 (3.13%) Data Manager
16 14 (2.57%) Developer
16 14 (2.57%) Project Manager
17 13 (2.39%) Solutions Architect
17 13 (2.39%) Technical Architect
18 12 (2.21%) Azure Architect
Libraries, Frameworks & Software Standards
1 45 (8.27%) PySpark
2 34 (6.25%) Kafka
3 12 (2.21%) REST
4 10 (1.84%) Middleware
5 9 (1.65%) OAuth
6 7 (1.29%) Great Expectations
6 7 (1.29%) LangChain
6 7 (1.29%) PyTorch
7 6 (1.10%) Apache NiFi
8 5 (0.92%) ARM Templates
8 5 (0.92%) Pandas
8 5 (0.92%) RESTful
8 5 (0.92%) SOAP
8 5 (0.92%) TensorFlow
9 4 (0.74%) .NET
9 4 (0.74%) FHIR
9 4 (0.74%) JSON
9 4 (0.74%) OpenID
9 4 (0.74%) SAML
9 4 (0.74%) XML
Miscellaneous
1 37 (6.80%) Data Structures
2 30 (5.51%) Cloud Native
3 28 (5.15%) Product Ownership
4 25 (4.60%) Onboarding
5 22 (4.04%) Management Information System
6 19 (3.49%) Analytical Mindset
7 16 (2.94%) Greenfield Project
7 16 (2.94%) Legacy Systems
7 16 (2.94%) Reference Data
7 16 (2.94%) Reinsurance
8 15 (2.76%) Low-Code
9 14 (2.57%) Data Protection Act
10 13 (2.39%) Taxonomies
11 11 (2.02%) Life Science
12 8 (1.47%) NHS
13 7 (1.29%) Data Fabric
13 7 (1.29%) Marketing Technology
14 6 (1.10%) Fixed Income
14 6 (1.10%) IoT
14 6 (1.10%) Virtual Team
Operating Systems
1 2 (0.37%) Android
1 2 (0.37%) Apple iOS
2 1 (0.18%) Windows
Processes & Methodologies
1 242 (44.49%) Data Modelling
2 174 (31.99%) Analytics
3 141 (25.92%) ETL
4 135 (24.82%) Agile
5 134 (24.63%) Business Intelligence
6 116 (21.32%) Problem-Solving
7 115 (21.14%) Data Pipeline
8 106 (19.49%) Data Engineering
9 101 (18.57%) Data Architecture
10 96 (17.65%) CI/CD
11 94 (17.28%) Stakeholder Management
12 89 (16.36%) Stakeholder Engagement
13 86 (15.81%) Data Management
13 86 (15.81%) DevOps
14 85 (15.63%) AI
14 85 (15.63%) Metadata Management
15 77 (14.15%) Data Integration
16 75 (13.79%) Migration
17 66 (12.13%) Data Lineage
17 66 (12.13%) Decision-Making
Programming Languages
1 216 (39.71%) SQL
2 162 (29.78%) Python
3 33 (6.07%) Java
4 21 (3.86%) Scala
5 19 (3.49%) R
6 11 (2.02%) JavaScript
7 10 (1.84%) Data Analysis Expressions
8 8 (1.47%) C#
9 7 (1.29%) PowerShell
9 7 (1.29%) TypeScript
10 6 (1.10%) Bicep
10 6 (1.10%) C++
10 6 (1.10%) T-SQL
11 4 (0.74%) C
11 4 (0.74%) Perl
11 4 (0.74%) PL/SQL
12 3 (0.55%) Apex Code
12 3 (0.55%) Korn
13 2 (0.37%) MATLAB
14 1 (0.18%) VBA
Qualifications
1 70 (12.87%) Security Cleared
2 59 (10.85%) SC Cleared
3 55 (10.11%) Degree
4 20 (3.68%) Azure Certification
4 20 (3.68%) Master's Degree
5 17 (3.13%) Computer Science Degree
6 14 (2.57%) AWS Certification
7 12 (2.21%) Microsoft Certification
8 10 (1.84%) PMI Certification
8 10 (1.84%) PMP
9 8 (1.47%) DV Cleared
10 6 (1.10%) CISSP
11 5 (0.92%) AWS Certified Solutions Architect
12 4 (0.74%) MCP
13 3 (0.55%) BPSS Clearance
14 2 (0.37%) DBS Check
14 2 (0.37%) SnowPro
14 2 (0.37%) TOGAF Certification
15 1 (0.18%) AWS Certified DevOps Engineer
15 1 (0.18%) PhD
Quality Assurance & Compliance
1 195 (35.85%) Data Quality
2 98 (18.01%) GDPR
3 29 (5.33%) QA
4 26 (4.78%) Accessibility
5 12 (2.21%) HIPAA
6 11 (2.02%) California Consumer Privacy Act
7 10 (1.84%) ISO/IEC 27001
8 7 (1.29%) NIST
9 6 (1.10%) MiFID
9 6 (1.10%) PMO
9 6 (1.10%) Solvency II
10 5 (0.92%) EU AI Act
11 4 (0.74%) HL7
11 4 (0.74%) IFRS
12 3 (0.55%) Basel III
12 3 (0.55%) Cyber Essentials
12 3 (0.55%) GMP
12 3 (0.55%) Sarbanes-Oxley
12 3 (0.55%) SOC 2
13 2 (0.37%) DICOM
System Software
1 28 (5.15%) Docker
2 8 (1.47%) Active Directory
3 1 (0.18%) VMware ESXi
3 1 (0.18%) VMware Infrastructure
Systems Management
1 52 (9.56%) Terraform
2 30 (5.51%) Kubernetes
3 3 (0.55%) Microsoft Intune
4 2 (0.37%) Ansible
4 2 (0.37%) Grafana
4 2 (0.37%) Prometheus
5 1 (0.18%) AirWatch
5 1 (0.18%) Kubeflow
5 1 (0.18%) Single Sign-On
Vendors
1 105 (19.30%) Databricks
2 99 (18.20%) Microsoft
3 35 (6.43%) Google
4 33 (6.07%) Salesforce
5 26 (4.78%) SAP
6 22 (4.04%) Informatica
7 20 (3.68%) Oracle
8 14 (2.57%) Sparx
9 10 (1.84%) OpenAI
10 9 (1.65%) Workday
11 8 (1.47%) Adobe
11 8 (1.47%) OneTrust
11 8 (1.47%) ServiceNow
12 7 (1.29%) Guidewire
12 7 (1.29%) Talend
13 6 (1.10%) Alteryx
13 6 (1.10%) Tealium
14 5 (0.92%) Bloomberg
15 4 (0.74%) Apple
15 4 (0.74%) MuleSoft