Analytical Skills Contract Job Trends in London

Analytical Skills
England > London

The table below looks at the prevalence of the term Analytical Skills in contract job vacancies in London. Included is a benchmarking guide to the contractor rates offered in vacancies that cited Analytical Skills over the 6 months leading up to 8 November 2025, comparing them to the same period in the previous two years.

6 months to
8 Nov 2025
Same period 2024 Same period 2023
Rank 18 20 20
Rank change year-on-year +2 0 +2
Contract jobs citing Analytical Skills 1,553 1,409 1,684
As % of all contract jobs in London 11.17% 8.99% 8.28%
As % of the General category 16.35% 14.31% 12.74%
Number of daily rates quoted 955 850 1,157
10th Percentile £313 £320 £325
25th Percentile £407 £436 £450
Median daily rate (50th Percentile) £520 £550 £550
Median % change year-on-year -5.45% - -8.33%
75th Percentile £650 £663 £675
90th Percentile £752 £763 £800
England median daily rate £500 £520 £534
% change year-on-year -3.85% -2.62% -2.91%
Number of hourly rates quoted 38 24 38
10th Percentile £18.25 £17.25 £21.18
25th Percentile £25.49 £22.07 £27.00
Median hourly rate £35.00 £30.30 £47.03
Median % change year-on-year +15.53% -35.58% +33.41%
75th Percentile £47.38 £50.00 £55.00
90th Percentile £63.00 £79.40 £66.20
England median hourly rate £34.38 £26.00 £35.00
% change year-on-year +32.21% -25.71% -

All General Skills
London

Analytical Skills falls under the General Skills category. For comparison with the information above, the following table provides summary statistics for all contract job vacancies requiring common skills in London.

Contract vacancies with a requirement for common skills 9,501 9,844 13,215
As % of all contract IT jobs advertised in London 68.31% 62.84% 64.96%
Number of daily rates quoted 6,214 6,295 9,592
10th Percentile £325 £325 £350
25th Percentile £425 £450 £463
Median daily rate (50th Percentile) £548 £575 £585
Median % change year-on-year -4.78% -1.71% -2.50%
75th Percentile £675 £690 £700
90th Percentile £788 £823 £800
England median daily rate £500 £525 £550
% change year-on-year -4.76% -4.55% -
Number of hourly rates quoted 197 111 169
10th Percentile £17.50 £17.50 £18.26
25th Percentile £22.50 £26.84 £21.00
Median hourly rate £28.50 £37.50 £35.25
Median % change year-on-year -24.00% +6.38% +13.71%
75th Percentile £45.00 £54.38 £58.75
90th Percentile £67.34 £76.25 £77.50
England median hourly rate £25.00 £31.56 £30.48
% change year-on-year -20.79% +3.56% +18.53%

Analytical Skills
Job Vacancy Trend in London

Historical trend showing the proportion of contract IT job postings citing Analytical Skills relative to all contract IT jobs advertised in London.
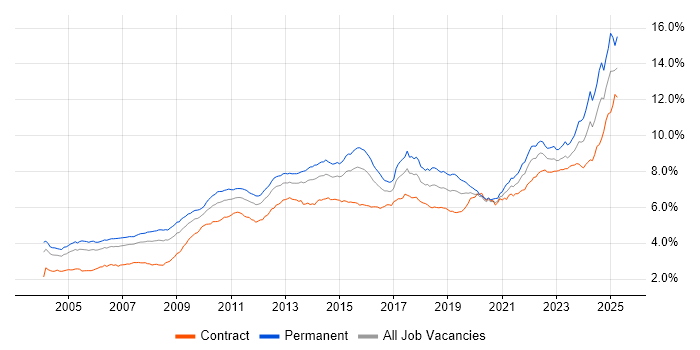
Analytical Skills job vacancy trend in London

Analytical Skills
Daily Rate Trend in London

Contractor daily rate distribution trend for jobs in London citing Analytical Skills.

Contractor daily rate distribution trend for jobs in London citing Analytical Skills

Analytical Skills
Daily Rate Histogram in London

Daily rate distribution for jobs citing Analytical Skills in London over the 6 months to 8 November 2025.

Daily rate histogram for Analytical Skills in London

Analytical Skills
Hourly Rate Trend in London

Contractor hourly rate distribution trend for jobs in London citing Analytical Skills.

Contractor hourly rate distribution trend for jobs in London citing Analytical Skills

Analytical Skills
Hourly Rate Histogram in London

Hourly rate distribution of jobs citing Analytical Skills in London over the 6 months to 8 November 2025.

Hourly rate histogram for Analytical Skills in London

Analytical Skills
Contract Job Locations in London

The table below looks at the demand and provides a guide to the median contractor rates quoted in IT jobs citing Analytical Skills within the London region over the 6 months to 8 November 2025. The 'Rank Change' column provides an indication of the change in demand within each location based on the same 6 month period last year.

Location Rank Change
on Same Period
Last Year
Matching
Contract
IT Job Ads
Median
Daily Rate
Past 6 Months
Median Daily Rate
% Change
on Same Period
Last Year
Live
Jobs
Central London +4 253 £525 -8.70% 1,174
West London -2 28 £425 +3.03% 89
South London 0 24 £625 +11.86% 44
East London +3 11 £450 +2.27% 54
North London 0 1 - - 10
Analytical Skills
England

Analytical Skills
Co-Occurring Skills & Capabilities in London by Category

The following tables expand on the one above by listing co-occurrences grouped by category. They cover the same employment type, locality and period, with up to 20 co-occurrences shown in each category:

Application Platforms
1 69 (4.44%) Confluence
2 38 (2.45%) SharePoint
3 29 (1.87%) Apache Spark
4 21 (1.35%) Microsoft Exchange
5 17 (1.09%) Apache Airflow
6 12 (0.77%) CMS
7 9 (0.58%) Apache
8 5 (0.32%) Anypoint
9 4 (0.26%) Jupyter
10 3 (0.19%) OpenStack
11 2 (0.13%) ArcGIS
11 2 (0.13%) Camunda
11 2 (0.13%) IIS
11 2 (0.13%) Luigi
11 2 (0.13%) Oracle Workflow
12 1 (0.064%) Apache Superset
12 1 (0.064%) CICS
12 1 (0.064%) NetWeaver
12 1 (0.064%) SAS
12 1 (0.064%) WebSphere Application Server
Applications
1 138 (8.89%) Microsoft Excel
2 55 (3.54%) Microsoft Office
3 48 (3.09%) Microsoft PowerPoint
4 30 (1.93%) MS Visio
5 19 (1.22%) Microsoft Project
6 10 (0.64%) Spreadsheet
7 6 (0.39%) ProjectWise
7 6 (0.39%) Trello
8 4 (0.26%) AutoCAD
8 4 (0.26%) Oracle Smart View
9 3 (0.19%) Chatbot
10 2 (0.13%) Notion
10 2 (0.13%) Revit
11 1 (0.064%) GNU Octave
11 1 (0.064%) Navisworks
11 1 (0.064%) OmniGraffle
Business Applications
1 22 (1.42%) SAP S/4HANA
2 12 (0.77%) Endur
3 10 (0.64%) SAP HR
4 9 (0.58%) Oracle EBS
5 8 (0.52%) Dynamics CRM
5 8 (0.52%) Oracle Financials
6 7 (0.45%) FLEXCUBE
6 7 (0.45%) Oracle BPM
6 7 (0.45%) Oracle EBS R12
7 5 (0.32%) Oracle Cash Management
7 5 (0.32%) Oracle ERP
7 5 (0.32%) Oracle Payables
7 5 (0.32%) Remedy ITSM
7 5 (0.32%) SAP MDG
7 5 (0.32%) Teamcenter
7 5 (0.32%) Workday HCM
8 4 (0.26%) ION MarketView
8 4 (0.26%) Oracle Assets
8 4 (0.26%) Oracle General Ledger
8 4 (0.26%) SAP SD
Cloud Services
1 247 (15.90%) Azure
2 217 (13.97%) AWS
3 172 (11.08%) Power Platform
4 80 (5.15%) GCP
5 59 (3.80%) SaaS
6 52 (3.35%) Microsoft 365
7 50 (3.22%) Azure DevOps
8 40 (2.58%) Entra ID
8 40 (2.58%) GitHub
9 35 (2.25%) Snowflake
10 33 (2.12%) Amazon S3
11 32 (2.06%) IaaS
12 29 (1.87%) Serverless
13 24 (1.55%) dbt
14 23 (1.48%) GitHub Actions
15 22 (1.42%) AWS Lambda
16 18 (1.16%) Azure Data Factory
16 18 (1.16%) PowerApps
17 16 (1.03%) AWS CloudFormation
18 14 (0.90%) PaaS
Communications & Networking
1 42 (2.70%) Firewall
2 32 (2.06%) DNS
3 27 (1.74%) Network Security
4 25 (1.61%) TCP/IP
5 20 (1.29%) VPN
6 17 (1.09%) LAN
7 16 (1.03%) WAN
8 15 (0.97%) HTTP
9 11 (0.71%) SSL
10 10 (0.64%) DHCP
10 10 (0.64%) VLAN
10 10 (0.64%) VoIP
11 9 (0.58%) Internet
12 7 (0.45%) SD-WAN
13 6 (0.39%) Wireless
14 5 (0.32%) BGP
14 5 (0.32%) CTI
14 5 (0.32%) SMTP
14 5 (0.32%) SSH
15 4 (0.26%) WLAN
Database & Business Intelligence
1 161 (10.37%) Power BI
2 83 (5.34%) Tableau
3 64 (4.12%) Data Warehouse
4 51 (3.28%) SQL Server
5 50 (3.22%) Relational Database
6 37 (2.38%) PostgreSQL
7 33 (2.12%) Metadata
8 30 (1.93%) DB2
8 30 (1.93%) MongoDB
9 26 (1.67%) Big Data
9 26 (1.67%) Data Lake
10 24 (1.55%) BigQuery
11 23 (1.48%) NoSQL
12 21 (1.35%) Looker
13 20 (1.29%) Hadoop
14 18 (1.16%) Star Schema
15 17 (1.09%) Power Query
16 14 (0.90%) Amazon Redshift
17 13 (0.84%) Oracle Reports
17 13 (0.84%) SQL Server Integration Services
Development Applications
1 129 (8.31%) JIRA
2 74 (4.76%) Git
3 30 (1.93%) Jenkins
4 27 (1.74%) JUnit
5 13 (0.84%) Selenium
6 10 (0.64%) GitLab
7 9 (0.58%) Postman
8 7 (0.45%) Bitbucket
8 7 (0.45%) Maven
9 6 (0.39%) Browser DevTools
9 6 (0.39%) IntelliJ
9 6 (0.39%) SonarQube
9 6 (0.39%) TestRail
9 6 (0.39%) webpack
10 5 (0.32%) Burp Suite
10 5 (0.32%) Eclipse
10 5 (0.32%) Gatling
10 5 (0.32%) LoadRunner
10 5 (0.32%) Visual Website Optimizer
10 5 (0.32%) Zephyr
General
1 846 (54.48%) Social Skills
2 559 (35.99%) Finance
3 225 (14.49%) Banking
4 118 (7.60%) Public Sector
5 93 (5.99%) Marketing
6 91 (5.86%) Investment Banking
7 68 (4.38%) Legal
8 59 (3.80%) Influencing Skills
9 56 (3.61%) Front Office
10 53 (3.41%) Organisational Skills
11 49 (3.16%) Financial Institution
11 49 (3.16%) Presentation Skills
12 47 (3.03%) Back Office
13 46 (2.96%) Telecoms
14 45 (2.90%) Documentation Skills
15 41 (2.64%) Retail
16 23 (1.48%) Inclusion and Diversity
17 21 (1.35%) Publishing
18 20 (1.29%) Military
19 18 (1.16%) Pharmaceutical
Job Titles
1 407 (26.21%) Analyst
2 196 (12.62%) Developer
3 185 (11.91%) Business Analyst
4 175 (11.27%) Senior
5 118 (7.60%) Architect
6 101 (6.50%) Lead
7 79 (5.09%) Data Analyst
8 71 (4.57%) Consultant
9 54 (3.48%) Data Engineer
10 53 (3.41%) Java Developer
11 51 (3.28%) Senior Developer
12 47 (3.03%) Senior Analyst
13 38 (2.45%) Project Manager
14 35 (2.25%) Solutions Architect
15 31 (2.00%) Python Developer
16 28 (1.80%) Technical Analyst
17 27 (1.74%) Security Analyst
18 26 (1.67%) Data Scientist
19 23 (1.48%) Senior Java Developer
19 23 (1.48%) SQL Developer
Libraries, Frameworks & Software Standards
1 100 (6.44%) REST
2 53 (3.41%) Kafka
3 47 (3.03%) JSON
4 43 (2.77%) .NET
5 39 (2.51%) Spring
6 38 (2.45%) HTML
7 36 (2.32%) React
8 31 (2.00%) AngularJS
9 30 (1.93%) CSS
10 28 (1.80%) RESTful
11 27 (1.74%) XML
12 25 (1.61%) SOAP
13 21 (1.35%) Web Services
14 20 (1.29%) OAuth
14 20 (1.29%) Pandas
15 19 (1.22%) Middleware
16 17 (1.09%) JMS
16 17 (1.09%) Spring Boot
17 16 (1.03%) SAML
18 15 (0.97%) OpenID
Miscellaneous
1 145 (9.34%) Analytical Mindset
2 70 (4.51%) Product Ownership
2 70 (4.51%) Self-Motivation
3 64 (4.12%) Management Information System
4 52 (3.35%) Data Structures
5 47 (3.03%) Algorithms
6 46 (2.96%) Onboarding
7 35 (2.25%) Foreign Exchange (FX)
8 31 (2.00%) Derivative
9 29 (1.87%) Data Protection Act
10 28 (1.80%) Enterprise Software
10 28 (1.80%) Equities
11 27 (1.74%) Fixed Income
12 26 (1.67%) Security Posture
13 25 (1.61%) Reinsurance
14 24 (1.55%) PKI
15 23 (1.48%) Cloud Native
16 20 (1.29%) Cyber Threat
16 20 (1.29%) Legacy Systems
17 17 (1.09%) Linux Command Line
Operating Systems
1 98 (6.31%) Linux
2 79 (5.09%) Windows
3 41 (2.64%) Unix
4 12 (0.77%) Windows Server
5 11 (0.71%) Windows 10
6 6 (0.39%) Red Hat Enterprise Linux
7 4 (0.26%) Mac OS
7 4 (0.26%) Solaris
7 4 (0.26%) VMS
8 3 (0.19%) Windows Server 2012
9 2 (0.13%) Android
9 2 (0.13%) Windows 7
9 2 (0.13%) Windows Server 2003
9 2 (0.13%) Windows Server 2008
10 1 (0.064%) AIX
10 1 (0.064%) Apple iOS
10 1 (0.064%) Kali Linux
10 1 (0.064%) VME
10 1 (0.064%) zOS
Processes & Methodologies
1 856 (55.12%) Problem-Solving
2 456 (29.36%) Agile
3 271 (17.45%) Stakeholder Management
4 270 (17.39%) Analytics
5 231 (14.87%) Decision-Making
6 193 (12.43%) Business Intelligence
7 184 (11.85%) Stakeholder Engagement
8 179 (11.53%) Data Analysis
9 173 (11.14%) Continuous Improvement
10 167 (10.75%) Data Modelling
11 160 (10.30%) CI/CD
12 154 (9.92%) DevOps
13 138 (8.89%) Migration
14 135 (8.69%) Actionable Insight
14 135 (8.69%) Computer Science
15 132 (8.50%) Project Management
16 131 (8.44%) Visualisation
17 130 (8.37%) AI
18 125 (8.05%) Scrum
19 114 (7.34%) Risk Management
Programming Languages
1 393 (25.31%) SQL
2 342 (22.02%) Python
3 140 (9.01%) Java
4 90 (5.80%) JavaScript
5 70 (4.51%) PowerShell
6 50 (3.22%) C#
7 43 (2.77%) Bash
8 31 (2.00%) Shell Script
9 30 (1.93%) TypeScript
10 25 (1.61%) C++
11 18 (1.16%) PL/SQL
12 17 (1.09%) R
13 16 (1.03%) Go
14 14 (0.90%) VBA
15 12 (0.77%) Data Analysis Expressions
16 11 (0.71%) T-SQL
17 9 (0.58%) Kusto Query Language
17 9 (0.58%) Scala
18 7 (0.45%) ABAP
19 6 (0.39%) C
Qualifications
1 244 (15.71%) Degree
2 201 (12.94%) Security Cleared
3 149 (9.59%) SC Cleared
4 72 (4.64%) Computer Science Degree
5 34 (2.19%) Master's Degree
6 31 (2.00%) PMI Certification
7 23 (1.48%) PMP
8 21 (1.35%) CISSP
9 20 (1.29%) DV Cleared
10 19 (1.22%) Azure Certification
11 15 (0.97%) CIMA
12 14 (0.90%) ACCA
12 14 (0.90%) Microsoft Certification
13 13 (0.84%) CBAP
13 13 (0.84%) OSCP
14 12 (0.77%) AWS Certification
14 12 (0.77%) BPSS Clearance
14 12 (0.77%) Cisco Certification
15 11 (0.71%) CompTIA Security+
15 11 (0.71%) Numerate Degree
Quality Assurance & Compliance
1 131 (8.44%) Data Quality
2 99 (6.37%) QA
3 45 (2.90%) Accessibility
3 45 (2.90%) GDPR
4 25 (1.61%) PMO
5 20 (1.29%) NIST
6 19 (1.22%) ISO/IEC 27001
7 16 (1.03%) SLA
8 11 (0.71%) WCAG
9 10 (0.64%) Sarbanes-Oxley
10 9 (0.58%) Actionable Recommendations
10 9 (0.58%) GRC
11 8 (0.52%) COBIT
12 7 (0.45%) California Consumer Privacy Act
12 7 (0.45%) EMIR
12 7 (0.45%) ISO 20022
13 6 (0.39%) ISO 19650
13 6 (0.39%) MiFID
14 5 (0.32%) SEPA
15 4 (0.26%) Basel III
System Software
1 62 (3.99%) Active Directory
2 49 (3.16%) Docker
3 11 (0.71%) VMware Infrastructure
4 10 (0.64%) zsh
5 6 (0.39%) HDFS
6 5 (0.32%) Firmware
7 4 (0.26%) Virtual Desktop
8 3 (0.19%) Virtual Machines
8 3 (0.19%) vSphere
9 2 (0.13%) ProxySG
9 2 (0.13%) Squid
10 1 (0.064%) BitLocker
10 1 (0.064%) Hyper-V
10 1 (0.064%) KVM
10 1 (0.064%) Postfix
10 1 (0.064%) Snort
10 1 (0.064%) VMware ESXi
10 1 (0.064%) VMware NSX
Systems Management
1 64 (4.12%) Kubernetes
2 56 (3.61%) Terraform
3 42 (2.70%) Ansible
4 18 (1.16%) Microsoft Intune
5 15 (0.97%) Grafana
5 15 (0.97%) Prometheus
6 14 (0.90%) Single Sign-On
7 13 (0.84%) SCCM
8 7 (0.45%) ITRS Geneos
8 7 (0.45%) Nessus
9 5 (0.32%) HP ALM
9 5 (0.32%) Nmap
10 4 (0.26%) BladeLogic
11 3 (0.19%) Argo
11 3 (0.19%) CA Spectrum
11 3 (0.19%) QRadar
11 3 (0.19%) SCOM
12 2 (0.13%) FortiGate
12 2 (0.13%) Packer
12 2 (0.13%) vRealize
Vendors
1 243 (15.65%) Microsoft
2 93 (5.99%) Oracle
3 73 (4.70%) SAP
4 66 (4.25%) Google
5 55 (3.54%) ServiceNow
6 51 (3.28%) Salesforce
7 43 (2.77%) Databricks
8 34 (2.19%) Splunk
9 28 (1.80%) Cisco
10 21 (1.35%) Sybase
10 21 (1.35%) VMware
11 17 (1.09%) Workday
12 16 (1.03%) Bloomberg
13 14 (0.90%) MuleSoft
13 14 (0.90%) Murex
14 13 (0.84%) Adobe
14 13 (0.84%) CyberArk
15 12 (0.77%) Alteryx
16 10 (0.64%) F5
16 10 (0.64%) HubSpot