Data Management Contract Job Trends in London

Data Management
England > London

The table below provides summary statistics and contractor rates for jobs advertised in London requiring Data Management skills. It covers contract job vacancies from the 6 months leading up to 21 November 2025, with comparisons to the same periods in the previous two years.

6 months to
21 Nov 2025
Same period 2024 Same period 2023
Rank 118 88 130
Rank change year-on-year -30 +42 +13
Contract jobs citing Data Management 349 425 394
As % of all contract jobs in London 2.46% 2.70% 1.98%
As % of the Processes & Methodologies category 2.67% 3.03% 2.21%
Number of daily rates quoted 223 262 279
10th Percentile £313 £325 £417
25th Percentile £406 £422 £500
Median daily rate (50th Percentile) £525 £531 £600
Median % change year-on-year -1.18% -11.46% -6.07%
75th Percentile £656 £675 £714
90th Percentile £775 £775 £800
England median daily rate £492 £519 £575
% change year-on-year -5.20% -9.74% -2.13%
Number of hourly rates quoted 5 8 8
10th Percentile - £23.78 £23.78
25th Percentile £17.00 £37.29 £25.28
Median hourly rate £18.00 £68.75 £43.55
Median % change year-on-year -73.82% +57.87% +12.38%
75th Percentile £23.45 £97.50 £54.00
90th Percentile £25.73 - £65.03
England median hourly rate £26.50 £33.22 £35.00
% change year-on-year -20.22% -5.10% -50.00%

All Process and Methodology Skills
London

Data Management falls under the Processes and Methodologies category. For comparison with the information above, the following table provides summary statistics for all contract job vacancies requiring process or methodology skills in London.

Contract vacancies with a requirement for process or methodology skills 13,068 14,030 17,858
As % of all contract IT jobs advertised in London 92.28% 89.29% 89.74%
Number of daily rates quoted 8,592 9,056 12,811
10th Percentile £334 £350 £355
25th Percentile £425 £450 £461
Median daily rate (50th Percentile) £537 £550 £569
Median % change year-on-year -2.36% -3.34% -3.56%
75th Percentile £655 £675 £688
90th Percentile £775 £800 £800
England median daily rate £505 £525 £545
% change year-on-year -3.81% -3.67% -0.91%
Number of hourly rates quoted 259 166 246
10th Percentile £17.98 £17.38 £18.68
25th Percentile £24.50 £23.98 £21.56
Median hourly rate £28.50 £37.50 £36.33
Median % change year-on-year -24.00% +3.21% -6.54%
75th Percentile £47.25 £55.94 £61.75
90th Percentile £67.87 £80.75 £76.25
England median hourly rate £25.15 £37.00 £44.50
% change year-on-year -32.03% -16.85% +23.61%

Data Management
Job Vacancy Trend in London

Historical trend showing the proportion of contract IT job postings citing Data Management relative to all contract IT jobs advertised in London.
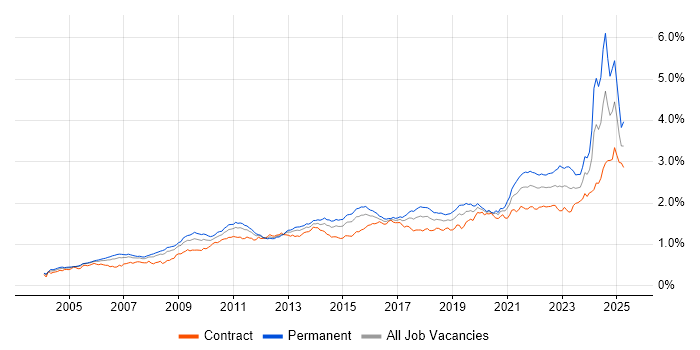
Data Management job vacancy trend in London

Data Management
Daily Rate Trend in London

Contractor daily rate distribution trend for jobs in London citing Data Management.

Contractor daily rate distribution trend for jobs in London citing Data Management

Data Management
Daily Rate Histogram in London

Daily rate distribution for jobs citing Data Management in London over the 6 months to 21 November 2025.

Daily rate histogram for Data Management in London

Data Management
Hourly Rate Trend in London

Contractor hourly rate distribution trend for jobs in London citing Data Management.

Contractor hourly rate distribution trend for jobs in London citing Data Management

Data Management
Contract Job Locations in London

The table below looks at the demand and provides a guide to the median contractor rates quoted in IT jobs citing Data Management within the London region over the 6 months to 21 November 2025. The 'Rank Change' column provides an indication of the change in demand within each location based on the same 6 month period last year.

Location Rank Change
on Same Period
Last Year
Matching
Contract
IT Job Ads
Median
Daily Rate
Past 6 Months
Median Daily Rate
% Change
on Same Period
Last Year
Live
Jobs
Central London -23 46 £600 +8.11% 107
South London -10 3 £583 +29.50%
West London -11 1 £190 -61.03% 2
Data Management
England

Data Management
Co-Occurring Skills & Capabilities in London by Category

The following tables expand on the one above by listing co-occurrences grouped by category. They cover the same employment type, locality and period, with up to 20 co-occurrences shown in each category:

Application Platforms
1 10 (2.87%) SharePoint
2 6 (1.72%) Apache
2 6 (1.72%) Apache Spark
3 5 (1.43%) Apache Airflow
4 3 (0.86%) Confluence
4 3 (0.86%) HCL Notes
5 2 (0.57%) Appian
5 2 (0.57%) ArcGIS
5 2 (0.57%) SAS
6 1 (0.29%) Adobe Experience Manager
6 1 (0.29%) CMS
6 1 (0.29%) Oracle SOA Suite
Applications
1 27 (7.74%) Microsoft Excel
2 14 (4.01%) Microsoft PowerPoint
3 11 (3.15%) Microsoft Office
4 9 (2.58%) MS Visio
5 6 (1.72%) ProjectWise
6 2 (0.57%) Microsoft Project
6 2 (0.57%) Revit
6 2 (0.57%) Spreadsheet
7 1 (0.29%) Navisworks
7 1 (0.29%) Oracle Smart View
7 1 (0.29%) SPSS
Business Applications
1 9 (2.58%) SAP S/4HANA
2 5 (1.43%) Dynamics CRM
2 5 (1.43%) Oracle Retail
2 5 (1.43%) Teamcenter
3 4 (1.15%) Aladdin
3 4 (1.15%) SAP MDG
4 3 (0.86%) Markit EDM
4 3 (0.86%) Oracle EBS
4 3 (0.86%) Oracle ERP
4 3 (0.86%) Sparx Enterprise Architect
4 3 (0.86%) Workday HCM
5 2 (0.57%) Eagle PACE
5 2 (0.57%) Salesforce CRM
5 2 (0.57%) SAP CO
5 2 (0.57%) SAP CX
5 2 (0.57%) Temenos T24
6 1 (0.29%) FIS Private Capital Suite
6 1 (0.29%) Hyperion Planning
6 1 (0.29%) iTrent
6 1 (0.29%) SAP Hybris
Cloud Services
1 79 (22.64%) Azure
2 51 (14.61%) Power Platform
3 43 (12.32%) AWS
4 26 (7.45%) Azure DevOps
5 21 (6.02%) Collibra
6 20 (5.73%) GCP
7 13 (3.72%) Snowflake
8 12 (3.44%) SaaS
9 11 (3.15%) Azure Data Factory
9 11 (3.15%) Azure Synapse Analytics
9 11 (3.15%) OCI
9 11 (3.15%) PowerApps
10 10 (2.87%) PaaS
11 9 (2.58%) Cloud Computing
12 8 (2.29%) Dynamics 365
12 8 (2.29%) Power Automate
12 8 (2.29%) Serverless
13 6 (1.72%) Azure Logic Apps
13 6 (1.72%) Salesforce Sales Cloud
13 6 (1.72%) Salesforce Service Cloud
Communications & Networking
1 3 (0.86%) NAS
2 1 (0.29%) 2G
2 1 (0.29%) 4G
2 1 (0.29%) 5G
2 1 (0.29%) DNS
2 1 (0.29%) HTTP
2 1 (0.29%) IPv4
2 1 (0.29%) MQTT
2 1 (0.29%) Network Security
2 1 (0.29%) Radio Access Network
2 1 (0.29%) SAN
2 1 (0.29%) TCP/IP
2 1 (0.29%) VLAN
2 1 (0.29%) WebEx
2 1 (0.29%) Wireless
Database & Business Intelligence
1 46 (13.18%) Power BI
2 36 (10.32%) Metadata
3 31 (8.88%) Data Warehouse
4 23 (6.59%) Data Lake
5 21 (6.02%) SQL Server
6 17 (4.87%) Tableau
7 12 (3.44%) SQL Server Integration Services
8 10 (2.87%) Azure SQL Database
8 10 (2.87%) Oracle Reports
8 10 (2.87%) Power Query
8 10 (2.87%) Relational Database
9 6 (1.72%) GIS
9 6 (1.72%) NoSQL
9 6 (1.72%) PostgreSQL
10 5 (1.43%) BigQuery
10 5 (1.43%) SQL Server Reporting Services
11 4 (1.15%) Apache Hive
11 4 (1.15%) MySQL
11 4 (1.15%) Oracle Database
12 3 (0.86%) MongoDB
Development Applications
1 33 (9.46%) JIRA
2 11 (3.15%) GitLab
3 9 (2.58%) Git
4 7 (2.01%) ERwin
5 6 (1.72%) Selenium
6 4 (1.15%) Appium
6 4 (1.15%) Jenkins
7 3 (0.86%) JMeter
7 3 (0.86%) Postman
7 3 (0.86%) PowerDesigner
8 2 (0.57%) Cucumber
8 2 (0.57%) Cypress.io
8 2 (0.57%) Gatling
8 2 (0.57%) JUnit
8 2 (0.57%) NUnit
8 2 (0.57%) REST Assured
8 2 (0.57%) SpecFlow
8 2 (0.57%) TestNG
8 2 (0.57%) TestRail
8 2 (0.57%) WebDriver
General
1 152 (43.55%) Finance
2 145 (41.55%) Social Skills
3 110 (31.52%) Analytical Skills
4 48 (13.75%) Banking
5 19 (5.44%) Public Sector
6 18 (5.16%) Presentation Skills
7 16 (4.58%) Retail
8 15 (4.30%) Financial Institution
9 12 (3.44%) Legal
9 12 (3.44%) Marketing
10 11 (3.15%) Local Government
11 10 (2.87%) Investment Banking
12 9 (2.58%) Documentation Skills
12 9 (2.58%) Front Office
12 9 (2.58%) Inclusion and Diversity
13 7 (2.01%) Organisational Skills
14 6 (1.72%) Corporate Banking
14 6 (1.72%) Influencing Skills
15 5 (1.43%) Law
15 5 (1.43%) Military
Job Titles
1 63 (18.05%) Analyst
2 55 (15.76%) Architect
3 40 (11.46%) Developer
4 29 (8.31%) Consultant
5 28 (8.02%) Lead
6 26 (7.45%) Business Analyst
6 26 (7.45%) Data Analyst
7 20 (5.73%) Data Architect
8 19 (5.44%) Senior
9 15 (4.30%) Data Engineer
10 14 (4.01%) ServiceNow Developer
11 13 (3.72%) Governance Analyst
12 12 (3.44%) Data Modeller
12 12 (3.44%) Solutions Architect
13 10 (2.87%) Azure Architect
13 10 (2.87%) Data Manager
13 10 (2.87%) Enterprise Architect
14 8 (2.29%) Data Business Analyst
14 8 (2.29%) Project Manager
15 7 (2.01%) Oracle Consultant
Libraries, Frameworks & Software Standards
1 22 (6.30%) REST
2 19 (5.44%) Oracle Fusion
2 19 (5.44%) SOAP
3 8 (2.29%) HTML
4 7 (2.01%) .NET
5 6 (1.72%) CSS
5 6 (1.72%) Kafka
5 6 (1.72%) Lightning Web Components
5 6 (1.72%) RESTful
6 5 (1.43%) MIDP
6 5 (1.43%) PySpark
7 4 (1.15%) JSON
7 4 (1.15%) Middleware
7 4 (1.15%) React
7 4 (1.15%) Web Services
8 3 (0.86%) GraphQL
8 3 (0.86%) Node.js
8 3 (0.86%) OAuth
8 3 (0.86%) Visualforce
8 3 (0.86%) XML
Miscellaneous
1 23 (6.59%) Management Information System
2 18 (5.16%) Onboarding
2 18 (5.16%) Product Ownership
3 15 (4.30%) Data Structures
4 14 (4.01%) CMDB
5 13 (3.72%) Legacy Systems
5 13 (3.72%) Reference Data
6 10 (2.87%) Cloud Native
7 9 (2.58%) Analytical Mindset
8 7 (2.01%) Reinsurance
9 6 (1.72%) Derivative
10 5 (1.43%) Fixed Income
10 5 (1.43%) Virtual Team
11 4 (1.15%) Algorithms
11 4 (1.15%) Data Protection Act
11 4 (1.15%) Distributed Systems
11 4 (1.15%) Enterprise Software
11 4 (1.15%) Housing Association
11 4 (1.15%) Mobile App
12 3 (0.86%) Equities
Operating Systems
1 4 (1.15%) Android
1 4 (1.15%) Apple iOS
1 4 (1.15%) Windows
2 3 (0.86%) Linux
3 2 (0.57%) Windows Server
4 1 (0.29%) Unix
Processes & Methodologies
1 107 (30.66%) Problem-Solving
2 99 (28.37%) Agile
3 89 (25.50%) Analytics
4 86 (24.64%) Data Governance
5 82 (23.50%) Data Modelling
6 71 (20.34%) Stakeholder Management
7 56 (16.05%) Business Intelligence
7 56 (16.05%) DevOps
8 54 (15.47%) Migration
9 47 (13.47%) Stakeholder Engagement
10 44 (12.61%) Data Architecture
11 41 (11.75%) Roadmaps
12 39 (11.17%) CI/CD
12 39 (11.17%) ETL
12 39 (11.17%) Validation
13 38 (10.89%) Data Analysis
14 35 (10.03%) Data Integration
14 35 (10.03%) Visualisation
15 32 (9.17%) Data Strategy
16 31 (8.88%) Data Migration
Programming Languages
1 88 (25.21%) SQL
2 45 (12.89%) Python
3 31 (8.88%) JavaScript
4 14 (4.01%) C#
5 13 (3.72%) Java
6 8 (2.29%) T-SQL
7 6 (1.72%) Groovy
8 4 (1.15%) Apex Code
8 4 (1.15%) Data Analysis Expressions
8 4 (1.15%) R
8 4 (1.15%) TypeScript
9 3 (0.86%) C++
9 3 (0.86%) Formula Language
9 3 (0.86%) LotusScript
9 3 (0.86%) PL/SQL
10 2 (0.57%) Bicep
10 2 (0.57%) MATLAB
10 2 (0.57%) PowerShell
10 2 (0.57%) Scala
10 2 (0.57%) Shell Script
Qualifications
1 46 (13.18%) Security Cleared
2 35 (10.03%) SC Cleared
3 34 (9.74%) Degree
4 8 (2.29%) Computer Science Degree
5 7 (2.01%) Microsoft Certification
6 4 (1.15%) Azure Certification
6 4 (1.15%) ISTQB
6 4 (1.15%) Master's Degree
7 3 (0.86%) BPSS Clearance
7 3 (0.86%) CIPD
8 2 (0.57%) OCA
8 2 (0.57%) Oracle Certification
9 1 (0.29%) CCAB
9 1 (0.29%) CISA
9 1 (0.29%) CISSP
9 1 (0.29%) CRISC
9 1 (0.29%) CSSLP
9 1 (0.29%) DV Cleared
9 1 (0.29%) PMI Certification
9 1 (0.29%) PMP
Quality Assurance & Compliance
1 75 (21.49%) Data Quality
2 28 (8.02%) QA
3 26 (7.45%) GDPR
4 10 (2.87%) Accessibility
5 7 (2.01%) PMO
6 6 (1.72%) ISO 19650
7 5 (1.43%) IFRS
8 4 (1.15%) California Consumer Privacy Act
9 3 (0.86%) IFRS 17
9 3 (0.86%) Solvency II
10 2 (0.57%) EMIR
10 2 (0.57%) GAAP
10 2 (0.57%) ISO/IEC 20000
10 2 (0.57%) MiFID
11 1 (0.29%) Dodd-Frank
11 1 (0.29%) GxP
11 1 (0.29%) IFRS 9
11 1 (0.29%) NIST
11 1 (0.29%) SLA
11 1 (0.29%) Software Quality Assurance
System Software
1 7 (2.01%) Docker
2 3 (0.86%) Active Directory
3 1 (0.29%) VMware Infrastructure
Systems Management
1 10 (2.87%) Kubernetes
2 6 (1.72%) Terraform
3 2 (0.57%) Ansible
4 1 (0.29%) Thomson Reuters DACS
4 1 (0.29%) vCenter Server
Vendors
1 59 (16.91%) Microsoft
2 46 (13.18%) Oracle
3 23 (6.59%) Databricks
4 21 (6.02%) SAP
4 21 (6.02%) ServiceNow
5 15 (4.30%) Salesforce
6 12 (3.44%) Google
6 12 (3.44%) Informatica
7 9 (2.58%) Bloomberg
7 9 (2.58%) Workday
8 8 (2.29%) Alteryx
9 7 (2.01%) Refinitiv
10 4 (1.15%) Dynatrace
10 4 (1.15%) Murex
10 4 (1.15%) Sparx
10 4 (1.15%) Talend
11 3 (0.86%) Foundry
11 3 (0.86%) Hyperion
11 3 (0.86%) Lotus
11 3 (0.86%) Palantir