Business Intelligence Contract Job Trends in London

Business Intelligence (BI)
England > London

The table below provides summary statistics and contractor rates for jobs advertised in London requiring Business Intelligence skills. It covers vacancies from the 6 months leading up to 16 September 2025, with comparisons to the same periods in the previous two years.

6 months to
16 Sep 2025
Same period 2024 Same period 2023
Rank 36 40 46
Rank change year-on-year +4 +6 +9
Contract jobs citing Business Intelligence 779 827 1,006
As % of all contract jobs advertised in London 5.84% 5.16% 4.54%
As % of the Processes & Methodologies category 6.31% 5.78% 5.02%
Number of daily rates quoted 523 568 693
10th Percentile £342 £300 £363
25th Percentile £413 £413 £425
Median daily rate (50th Percentile) £525 £525 £530
Median % change year-on-year - -0.94% -1.94%
75th Percentile £631 £625 £650
90th Percentile £788 £731 £702
England median daily rate £500 £500 £500
% change year-on-year - - -4.76%
Number of hourly rates quoted 15 14 12
10th Percentile £21.67 £25.40 £19.38
25th Percentile £30.54 £34.51 £31.38
Median hourly rate £34.65 £53.75 £36.82
Median % change year-on-year -35.53% +46.00% +5.19%
75th Percentile £47.23 £78.13 £53.04
90th Percentile £74.75 £86.13 £56.18
England median hourly rate £32.05 £30.30 £32.32
% change year-on-year +5.79% -6.27% +29.33%

All Process and Methodology Skills
London

Business Intelligence falls under the Processes and Methodologies category. For comparison with the information above, the following table provides summary statistics for all contract job vacancies requiring process or methodology skills in London.

Contract vacancies with a requirement for process or methodology skills 12,340 14,309 20,036
As % of all contract IT jobs advertised in London 92.56% 89.21% 90.46%
Number of daily rates quoted 8,163 9,544 14,525
10th Percentile £325 £350 £363
25th Percentile £425 £450 £463
Median daily rate (50th Percentile) £538 £550 £575
Median % change year-on-year -2.27% -4.35% -0.86%
75th Percentile £675 £675 £695
90th Percentile £775 £800 £800
England median daily rate £508 £525 £550
% change year-on-year -3.33% -4.55% -
Number of hourly rates quoted 253 180 230
10th Percentile £17.02 £17.25 £18.15
25th Percentile £25.00 £23.80 £21.81
Median hourly rate £32.00 £35.00 £39.63
Median % change year-on-year -8.57% -11.67% +7.09%
75th Percentile £48.75 £55.00 £63.94
90th Percentile £63.75 £72.19 £77.50
England median hourly rate £25.15 £43.00 £43.54
% change year-on-year -41.51% -1.24% +50.14%

Business Intelligence
Job Vacancy Trend in London

Job postings citing Business Intelligence as a proportion of all IT jobs advertised in London.

Job vacancy trend for Business Intelligence in London

Business Intelligence
Daily Rate Trend in London

Contractor daily rate distribution trend for jobs in London citing Business Intelligence.
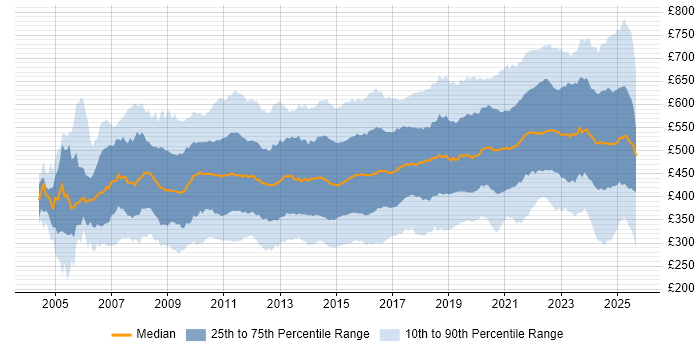
Contractor daily rate distribution trend for jobs in London citing Business Intelligence

Business Intelligence
Daily Rate Histogram in London

Daily rate distribution for jobs citing Business Intelligence in London over the 6 months to 16 September 2025.

Daily rate histogram for Business Intelligence in London

Business Intelligence
Hourly Rate Trend in London

Contractor hourly rate distribution trend for jobs in London citing Business Intelligence.

Contractor hourly rate distribution trend for jobs in London citing Business Intelligence

Business Intelligence
Hourly Rate Histogram in London

Hourly rate distribution of jobs citing Business Intelligence in London over the 6 months to 16 September 2025.

Hourly rate histogram for Business Intelligence in London

Business Intelligence
Contract Job Locations in London

The table below looks at the demand and provides a guide to the median contractor rates quoted in IT jobs citing Business Intelligence within the London region over the 6 months to 16 September 2025. The 'Rank Change' column provides an indication of the change in demand within each location based on the same 6 month period last year.

Location Rank Change
on Same Period
Last Year
Matching
Contract
IT Job Ads
Median
Daily Rate
Past 6 Months
Median Daily Rate
% Change
on Same Period
Last Year
Live
Jobs
Central London +12 126 £550 +2.33% 223
West London -8 16 £500 +8.70% 31
East London +6 7 £525 +14.13% 8
South London -8 7 £275 -38.89% 11
North London -9 1 - - 8
Business Intelligence
England

Business Intelligence
Co-occurring Skills and Capabilities in London by Category

The follow tables expand on the table above by listing co-occurrences grouped by category. The same employment type, locality and period is covered with up to 20 co-occurrences shown in each of the following categories:

Application Platforms
1 51 (6.55%) SharePoint
2 27 (3.47%) Confluence
3 20 (2.57%) Apache Airflow
4 18 (2.31%) Oracle Workflow
5 14 (1.80%) Apache Spark
6 9 (1.16%) HCL Notes
7 8 (1.03%) Microsoft Exchange
8 7 (0.90%) Apache
9 6 (0.77%) Oracle SOA Suite
9 6 (0.77%) SAS
10 5 (0.64%) Oracle Self-Service HR
11 4 (0.51%) CMS
12 3 (0.39%) Luigi
13 2 (0.26%) Apache Solr
13 2 (0.26%) Headless CMS
13 2 (0.26%) Moodle
13 2 (0.26%) Tomcat
14 1 (0.13%) ArcGIS
14 1 (0.13%) NetWeaver
14 1 (0.13%) SAP Portal
Applications
1 108 (13.86%) Microsoft Excel
2 31 (3.98%) Microsoft Office
2 31 (3.98%) Microsoft PowerPoint
3 16 (2.05%) MS Visio
4 15 (1.93%) Microsoft Project
5 5 (0.64%) Spreadsheet
6 4 (0.51%) Oracle Smart View
7 1 (0.13%) Adobe After Effects
7 1 (0.13%) Adobe Premiere
7 1 (0.13%) Adobe XD
7 1 (0.13%) InVision
7 1 (0.13%) Notion
7 1 (0.13%) Photoshop
7 1 (0.13%) Sketch
7 1 (0.13%) Trello
Business Applications
1 29 (3.72%) Aladdin
2 24 (3.08%) Dynamics CRM
3 18 (2.31%) Oracle EBS
4 16 (2.05%) Oracle Payables
4 16 (2.05%) thinkFolio
5 13 (1.67%) SAP S/4HANA
6 11 (1.41%) Oracle EBS R12
7 10 (1.28%) Oracle Assets
7 10 (1.28%) Oracle General Ledger
8 9 (1.16%) Oracle Financials
9 8 (1.03%) Workday HCM
10 7 (0.90%) NetSuite
10 7 (0.90%) Salesforce CRM
11 6 (0.77%) Oracle ERP
12 5 (0.64%) Oracle Payroll
13 4 (0.51%) SAP APO
13 4 (0.51%) SAP MDG
14 3 (0.39%) Loan IQ
14 3 (0.39%) NEC Housing
14 3 (0.39%) Oracle Receivables
Cloud Services
1 507 (65.08%) Power Platform
2 226 (29.01%) Azure
3 90 (11.55%) AWS
4 89 (11.42%) Power Automate
5 78 (10.01%) PowerApps
6 59 (7.57%) Snowflake
7 58 (7.45%) Azure DevOps
8 51 (6.55%) Azure Data Factory
8 51 (6.55%) Azure Synapse Analytics
8 51 (6.55%) GCP
9 49 (6.29%) Dynamics 365
10 40 (5.13%) dbt
11 35 (4.49%) Microsoft 365
12 31 (3.98%) SaaS
13 23 (2.95%) Azure Logic Apps
13 23 (2.95%) GitHub
14 22 (2.82%) Serverless
15 21 (2.70%) Entra ID
16 20 (2.57%) Amazon S3
17 14 (1.80%) Microsoft Copilot
Communications & Networking
1 5 (0.64%) Firewall
2 3 (0.39%) DHCP
2 3 (0.39%) DNS
3 2 (0.26%) BGP
3 2 (0.26%) BIG-IP
3 2 (0.26%) F5 BIG-IP GTM
3 2 (0.26%) F5 BIG-IP LTM
3 2 (0.26%) LAN
3 2 (0.26%) Network Security
3 2 (0.26%) OSPF
3 2 (0.26%) SD-WAN
3 2 (0.26%) TCP/IP
3 2 (0.26%) VPN
3 2 (0.26%) WAN
4 1 (0.13%) Intrusion Detection
4 1 (0.13%) VoIP
Database & Business Intelligence
1 505 (64.83%) Power BI
2 118 (15.15%) Tableau
3 100 (12.84%) Data Warehouse
4 57 (7.32%) Data Lake
5 50 (6.42%) SQL Server
6 45 (5.78%) Power Query
7 34 (4.36%) Metadata
7 34 (4.36%) Oracle BI Publisher
8 33 (4.24%) Relational Database
9 29 (3.72%) Oracle Reports
10 26 (3.34%) BigQuery
10 26 (3.34%) Looker
11 23 (2.95%) Amazon Redshift
12 22 (2.82%) SQL Server Integration Services
12 22 (2.82%) SQL Server Reporting Services
13 19 (2.44%) Azure SQL Database
14 18 (2.31%) PostgreSQL
15 15 (1.93%) Data Mining
15 15 (1.93%) Snowflake Schema
16 13 (1.67%) NoSQL
Development Applications
1 53 (6.80%) JIRA
2 29 (3.72%) Git
3 14 (1.80%) Liquibase
4 12 (1.54%) GitLab
5 10 (1.28%) Gradle
5 10 (1.28%) Jenkins
5 10 (1.28%) JUnit
5 10 (1.28%) Mockito
6 9 (1.16%) Oracle Forms
7 6 (0.77%) Oracle APEX
7 6 (0.77%) SonarQube
8 5 (0.64%) ERwin
8 5 (0.64%) MLflow
8 5 (0.64%) Terragrunt
9 4 (0.51%) Clang
9 4 (0.51%) GCC
9 4 (0.51%) Subversion
10 2 (0.26%) Bitbucket
10 2 (0.26%) Mercurial
10 2 (0.26%) Visual Studio
General
1 349 (44.80%) Finance
2 275 (35.30%) Social Skills
3 156 (20.03%) Analytical Skills
4 102 (13.09%) Public Sector
5 88 (11.30%) Marketing
6 75 (9.63%) Banking
7 59 (7.57%) Telecoms
8 56 (7.19%) Manufacturing
9 49 (6.29%) Electronics
10 45 (5.78%) Front Office
11 40 (5.13%) Investment Banking
12 26 (3.34%) Presentation Skills
13 21 (2.70%) Organisational Skills
13 21 (2.70%) Retail
14 20 (2.57%) Legal
15 17 (2.18%) Local Government
16 16 (2.05%) Inclusion and Diversity
17 15 (1.93%) Documentation Skills
18 13 (1.67%) General Ledger
19 10 (1.28%) Back Office
Job Titles
1 203 (26.06%) Analyst
2 134 (17.20%) Developer
3 89 (11.42%) Data Analyst
4 80 (10.27%) Senior
5 74 (9.50%) Business Analyst
6 73 (9.37%) Architect
7 72 (9.24%) Data Engineer
8 53 (6.80%) Lead
9 46 (5.91%) Consultant
10 36 (4.62%) Business Intelligence Developer
11 34 (4.36%) Data Architect
12 29 (3.72%) Business Manager
13 25 (3.21%) Fixed Income Business Analyst
14 24 (3.08%) Oracle Developer
15 23 (2.95%) Power BI Developer
16 22 (2.82%) Business Intelligence Analyst
16 22 (2.82%) Project Manager
16 22 (2.82%) Solutions Architect
17 19 (2.44%) Azure Engineer
18 18 (2.31%) Power Platform Developer
Libraries, Frameworks & Software Standards
1 37 (4.75%) .NET
2 32 (4.11%) PySpark
3 22 (2.82%) Kafka
4 21 (2.70%) REST
5 15 (1.93%) HTML
5 15 (1.93%) React
6 13 (1.67%) Oracle Fusion
7 12 (1.54%) Swagger
8 11 (1.41%) CSS
8 11 (1.41%) SOAP
9 10 (1.28%) OpenAPI
9 10 (1.28%) Spring
9 10 (1.28%) Spring Boot
10 9 (1.16%) HTML5 Canvas
10 9 (1.16%) JSON
10 9 (1.16%) RESTful
11 8 (1.03%) Middleware
11 8 (1.03%) Pandas
12 7 (0.90%) scikit-learn
12 7 (0.90%) Web Services
Miscellaneous
1 39 (5.01%) Derivative
2 34 (4.36%) Fixed Income
3 32 (4.11%) Onboarding
4 27 (3.47%) Hedge funds
5 21 (2.70%) Management Information System
6 19 (2.44%) Data Structures
7 18 (2.31%) Analytical Mindset
7 18 (2.31%) Legacy Systems
8 16 (2.05%) Product Ownership
8 16 (2.05%) Virtual Team
9 15 (1.93%) Algorithms
10 13 (1.67%) Data Protection Act
10 13 (1.67%) Greenfield Project
11 12 (1.54%) NHS
11 12 (1.54%) Reinsurance
12 11 (1.41%) Market Risk
12 11 (1.41%) Reference Data
12 11 (1.41%) Self-Motivation
13 9 (1.16%) Cloud Native
13 9 (1.16%) Low-Code
Operating Systems
1 18 (2.31%) Windows
2 13 (1.67%) Linux
2 13 (1.67%) Unix
3 5 (0.64%) Windows Server
4 3 (0.39%) Windows 10
5 2 (0.26%) Mac OS X
5 2 (0.26%) Red Hat Enterprise Linux
5 2 (0.26%) Windows 8
5 2 (0.26%) Windows XP
6 1 (0.13%) Mac OS
Processes & Methodologies
1 260 (33.38%) Analytics
2 226 (29.01%) Agile
3 210 (26.96%) Data Modelling
4 173 (22.21%) Visualisation
5 147 (18.87%) Problem-Solving
6 118 (15.15%) Decision-Making
7 116 (14.89%) Data Governance
8 110 (14.12%) Data Visualisation
8 110 (14.12%) ETL
9 107 (13.74%) Data Analysis
10 106 (13.61%) Stakeholder Management
11 103 (13.22%) DevOps
12 91 (11.68%) Migration
13 85 (10.91%) Stakeholder Engagement
14 83 (10.65%) Actionable Insight
15 81 (10.40%) Data Pipeline
16 79 (10.14%) CI/CD
16 79 (10.14%) Data Engineering
17 68 (8.73%) Data Science
18 66 (8.47%) Dashboard Development
Programming Languages
1 398 (51.09%) SQL
2 207 (26.57%) Python
3 46 (5.91%) Data Analysis Expressions
4 38 (4.88%) C#
5 36 (4.62%) PL/SQL
6 35 (4.49%) Java
6 35 (4.49%) R
7 32 (4.11%) JavaScript
8 26 (3.34%) PowerShell
9 19 (2.44%) T-SQL
10 17 (2.18%) TypeScript
11 14 (1.80%) VBA
12 9 (1.16%) Scala
13 7 (0.90%) Bash
13 7 (0.90%) Groovy
14 6 (0.77%) C++
15 5 (0.64%) MATLAB
16 4 (0.51%) C
16 4 (0.51%) Formula Language
16 4 (0.51%) LotusScript
Qualifications
1 104 (13.35%) Security Cleared
2 88 (11.30%) SC Cleared
3 77 (9.88%) Degree
4 16 (2.05%) Microsoft Certification
5 15 (1.93%) Azure Certification
6 13 (1.67%) Computer Science Degree
6 13 (1.67%) PMI Certification
7 12 (1.54%) Master's Degree
8 10 (1.28%) PMP
9 6 (0.77%) ACCA
9 6 (0.77%) DV Cleared
10 5 (0.64%) BPSS Clearance
10 5 (0.64%) CFA
10 5 (0.64%) Cisco Certification
11 4 (0.51%) AWS Certification
11 4 (0.51%) CCNP
11 4 (0.51%) CIMA
12 3 (0.39%) CBAP
12 3 (0.39%) CCNA
12 3 (0.39%) PhD
Quality Assurance & Compliance
1 99 (12.71%) Data Quality
2 40 (5.13%) GDPR
3 35 (4.49%) QA
4 22 (2.82%) PMO
5 14 (1.80%) Accessibility
6 10 (1.28%) IFRS
7 8 (1.03%) Basel II
7 8 (1.03%) Sarbanes-Oxley
8 5 (0.64%) MiFID
9 4 (0.51%) COBIT
9 4 (0.51%) SLA
10 3 (0.39%) Def Stans
10 3 (0.39%) EMIR
10 3 (0.39%) HL7
10 3 (0.39%) ISO/IEC 27001
11 2 (0.26%) Actionable Recommendations
11 2 (0.26%) Basel III
11 2 (0.26%) HIPAA
12 1 (0.13%) DICOM
12 1 (0.13%) Solvency II
System Software
1 24 (3.08%) Active Directory
2 17 (2.18%) Docker
3 3 (0.39%) Firmware
3 3 (0.39%) XenApp
4 2 (0.26%) VMware ESXi
4 2 (0.26%) VMware Infrastructure
4 2 (0.26%) vSphere
5 1 (0.13%) Xen
Systems Management
1 30 (3.85%) Terraform
2 4 (0.51%) Ansible
2 4 (0.51%) Kubeflow
3 3 (0.39%) Kubernetes
3 3 (0.39%) Puppet
3 3 (0.39%) Single Sign-On
4 2 (0.26%) Grafana
4 2 (0.26%) McAfee ePO
4 2 (0.26%) Microsoft Intune
4 2 (0.26%) Norton AntiVirus
4 2 (0.26%) SCCM
4 2 (0.26%) vCenter Server
5 1 (0.13%) Istio
5 1 (0.13%) Opsgenie
5 1 (0.13%) Prometheus
Vendors
1 195 (25.03%) Microsoft
2 92 (11.81%) SAP
3 77 (9.88%) Oracle
4 66 (8.47%) Databricks
5 35 (4.49%) Google
6 28 (3.59%) Salesforce
7 27 (3.47%) ServiceNow
8 25 (3.21%) BISAM
9 19 (2.44%) Alteryx
10 16 (2.05%) Calypso
10 16 (2.05%) Charles River
10 16 (2.05%) SimCorp
11 15 (1.93%) Adobe
12 11 (1.41%) Talend
13 9 (1.16%) Lotus
13 9 (1.16%) Workday
14 8 (1.03%) Informatica
15 6 (0.77%) Cisco
15 6 (0.77%) DocuSign
15 6 (0.77%) MicroStrategy