SLA Contract Job Trends in the Midlands

Service Level Agreement (SLA)
England > Midlands

The table below provides summary statistics and contractor rates for jobs advertised in the Midlands requiring SLA skills. It covers contract job vacancies from the 6 months leading up to 30 September 2025, with comparisons to the same periods in the previous two years.

6 months to
30 Sep 2025
Same period 2024 Same period 2023
Rank 87 74 104
Rank change year-on-year -13 +30 -9
Contract jobs citing SLA 65 57 42
As % of all contract jobs in the Midlands 2.42% 2.14% 1.43%
As % of the Quality Assurance & Compliance category 14.04% 14.14% 9.93%
Number of daily rates quoted 44 29 22
10th Percentile £163 £158 £187
25th Percentile £220 £213 £223
Median daily rate (50th Percentile) £363 £350 £384
Median % change year-on-year +3.57% -8.79% +53.50%
75th Percentile £441 £475 £464
90th Percentile £503 £517 £525
England median daily rate £375 £300 £400
% change year-on-year +25.00% -25.00% +23.08%
Number of hourly rates quoted 7 6 6
10th Percentile £16.06 £12.75 £10.76
25th Percentile £16.12 £13.24 £11.20
Median hourly rate £16.13 £14.70 £15.47
Median % change year-on-year +9.73% -4.99% -21.32%
75th Percentile £22.97 £16.55 £20.19
90th Percentile £25.11 £36.08 £21.87
England median hourly rate £22.14 £19.18 £17.50
% change year-on-year +15.43% +9.60% +4.95%

All Quality Assurance and Compliance Skills
Midlands

SLA falls under the Quality Assurance and Compliance category. For comparison with the information above, the following table provides summary statistics for all contract job vacancies requiring quality assurance or compliance skills in the Midlands.

Contract vacancies with a requirement for quality assurance or compliance skills 463 403 423
As % of all contract IT jobs advertised in the Midlands 17.21% 15.12% 14.38%
Number of daily rates quoted 333 246 284
10th Percentile £302 £236 £300
25th Percentile £375 £353 £410
Median daily rate (50th Percentile) £450 £498 £500
Median % change year-on-year -9.55% -0.50% +11.11%
75th Percentile £550 £595 £588
90th Percentile £650 £725 £688
England median daily rate £500 £525 £540
% change year-on-year -4.76% -2.78% +2.86%
Number of hourly rates quoted 20 19 25
10th Percentile £15.12 £12.00 £12.98
25th Percentile £16.12 £13.14 £17.13
Median hourly rate £25.04 £21.00 £27.50
Median % change year-on-year +19.23% -23.64% +39.84%
75th Percentile £34.16 £49.38 £31.76
90th Percentile £40.46 £55.75 £70.00
England median hourly rate £32.50 £35.00 £39.60
% change year-on-year -7.14% -11.62% +76.00%

SLA
Job Vacancy Trend in the Midlands

Job postings citing SLA as a proportion of all IT jobs advertised in the Midlands.
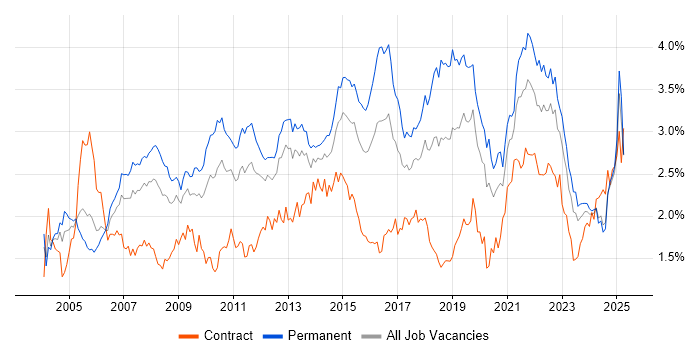
Job vacancy trend for SLA in the Midlands

SLA
Daily Rate Trend in the Midlands

Contractor daily rate distribution trend for jobs in the Midlands citing SLA.

Contractor daily rate distribution trend for jobs in the Midlands citing SLA

SLA
Daily Rate Histogram in the Midlands

Daily rate distribution for jobs citing SLA in the Midlands over the 6 months to 30 September 2025.

Daily rate histogram for SLA in the Midlands

SLA
Hourly Rate Trend in the Midlands

Contractor hourly rate distribution trend for jobs in the Midlands citing SLA.

Contractor hourly rate distribution trend for jobs in the Midlands citing SLA

SLA
Contract Job Locations in the Midlands

The table below looks at the demand and provides a guide to the median contractor rates quoted in IT jobs citing SLA within the Midlands region over the 6 months to 30 September 2025. The 'Rank Change' column provides an indication of the change in demand within each location based on the same 6 month period last year.

Location Rank Change
on Same Period
Last Year
Matching
Contract
IT Job Ads
Median
Daily Rate
Past 6 Months
Median Daily Rate
% Change
on Same Period
Last Year
Live
Jobs
West Midlands +4 54 £390 +11.43% 19
East Midlands -13 11 £134 -71.79% 19
SLA
England

SLA
Co-occurring Skills and Capabilities in the Midlands by Category

The follow tables expand on the table above by listing co-occurrences grouped by category. The same employment type, locality and period is covered with up to 20 co-occurrences shown in each of the following categories:

Application Platforms
1 7 (10.77%) Oracle Self-Service HR
1 7 (10.77%) Oracle Workflow
2 6 (9.23%) Microsoft Exchange
3 5 (7.69%) SharePoint
4 1 (1.54%) Confluence
Applications
1 7 (10.77%) Microsoft Office
2 6 (9.23%) Microsoft Excel
Business Applications
1 7 (10.77%) Oracle HRMS
2 2 (3.08%) Oracle Assets
2 2 (3.08%) Oracle EBS
2 2 (3.08%) Oracle EBS R12
2 2 (3.08%) Oracle ERP
2 2 (3.08%) Oracle General Ledger
2 2 (3.08%) Oracle iProcurement
2 2 (3.08%) Oracle Payables
2 2 (3.08%) Oracle Receivables
3 1 (1.54%) SAP Oil and Gas
3 1 (1.54%) SAP S/4HANA
Cloud Services
1 7 (10.77%) Microsoft 365
2 3 (4.62%) Azure
3 2 (3.08%) AWS
3 2 (3.08%) Azure Logic Apps
3 2 (3.08%) SuccessFactors
4 1 (1.54%) Entra ID
4 1 (1.54%) Power Platform
4 1 (1.54%) SaaS
Communications & Networking
1 6 (9.23%) Firewall
2 5 (7.69%) Structured Cabling
3 4 (6.15%) DHCP
3 4 (6.15%) DNS
4 3 (4.62%) SD-WAN
4 3 (4.62%) Wireless
4 3 (4.62%) Wireshark
5 2 (3.08%) Ethereal
5 2 (3.08%) Intrusion Detection
5 2 (3.08%) Network Security
5 2 (3.08%) PuTTY
5 2 (3.08%) SSH
5 2 (3.08%) Telnet
5 2 (3.08%) VPN
6 1 (1.54%) Broadband
6 1 (1.54%) DKIM
6 1 (1.54%) DMARC
6 1 (1.54%) VLAN
6 1 (1.54%) VoIP
6 1 (1.54%) WAN
Database & Business Intelligence
1 4 (6.15%) Oracle Reports
2 3 (4.62%) OLTP
2 3 (4.62%) SQL Server Reporting Services
3 1 (1.54%) Power BI
3 1 (1.54%) SQL Server
Development Applications
1 1 (1.54%) GitLab
1 1 (1.54%) JIRA
1 1 (1.54%) TestDirector
General
1 29 (44.62%) Social Skills
2 19 (29.23%) Analytical Skills
3 10 (15.38%) Finance
4 5 (7.69%) Public Sector
5 2 (3.08%) Automotive
5 2 (3.08%) Documentation Skills
5 2 (3.08%) Legal
6 1 (1.54%) Local Government
6 1 (1.54%) Manufacturing
6 1 (1.54%) Military
6 1 (1.54%) Organisational Skills
6 1 (1.54%) Presentation Skills
6 1 (1.54%) Telecoms
Job Titles
1 8 (12.31%) Support Engineer
2 7 (10.77%) Analyst
2 7 (10.77%) Oracle Specialist
3 6 (9.23%) Break Fix Engineer
3 6 (9.23%) Desktop Engineer
3 6 (9.23%) Lead
4 5 (7.69%) Desktop Support
4 5 (7.69%) Desktop Support Engineer
4 5 (7.69%) Support Assistant
5 4 (6.15%) IT Manager
6 3 (4.62%) Operations Analyst
6 3 (4.62%) SCCM Engineer
6 3 (4.62%) Team Leader
7 2 (3.08%) Hardware Engineer
7 2 (3.08%) IT Engineer
7 2 (3.08%) Monitoring Team Leader
7 2 (3.08%) SAP Manager
7 2 (3.08%) Security Operations Analyst
7 2 (3.08%) SIEM Engineer
7 2 (3.08%) Workday Manager
Libraries, Frameworks & Software Standards
1 2 (3.08%) Elastic Stack
1 2 (3.08%) Software Packaging
Miscellaneous
1 4 (6.15%) Security Posture
2 3 (4.62%) Management Information System
2 3 (4.62%) Onboarding
2 3 (4.62%) Product Ownership
3 2 (3.08%) Data Centre
3 2 (3.08%) Replication
4 1 (1.54%) Industrial Internet of Things
4 1 (1.54%) IoT
4 1 (1.54%) Self-Motivation
Operating Systems
1 13 (20.00%) Windows
2 8 (12.31%) Windows 10
3 6 (9.23%) Apple iOS
4 5 (7.69%) Android
5 3 (4.62%) Linux
6 2 (3.08%) Windows 7
6 2 (3.08%) Windows 8
7 1 (1.54%) Unix
7 1 (1.54%) Windows Server
Processes & Methodologies
1 24 (36.92%) ITIL
2 15 (23.08%) Problem-Solving
3 14 (21.54%) Service Management
4 11 (16.92%) Customer Service
5 8 (12.31%) Workflow
6 7 (10.77%) Business Intelligence
6 7 (10.77%) Incident Management
6 7 (10.77%) Process Improvement
7 6 (9.23%) Break/Fix
7 6 (9.23%) Capacity Planning
7 6 (9.23%) Continuous Improvement
7 6 (9.23%) High Availability
7 6 (9.23%) Mentoring
8 5 (7.69%) Patch Management
8 5 (7.69%) Problem Management
8 5 (7.69%) Root Cause Analysis
8 5 (7.69%) Test Scripting
8 5 (7.69%) Ticket Management
9 4 (6.15%) Performance Metrics
9 4 (6.15%) SIEM
Programming Languages
1 18 (27.69%) SQL
2 7 (10.77%) PowerShell
3 2 (3.08%) Bash
3 2 (3.08%) Kusto Query Language
3 2 (3.08%) PL/SQL
3 2 (3.08%) Python
3 2 (3.08%) VBScript
4 1 (1.54%) JavaScript
4 1 (1.54%) Shell Script
Qualifications
1 12 (18.46%) Security Cleared
2 6 (9.23%) SC Cleared
3 5 (7.69%) ITIL Foundation Certificate
4 4 (6.15%) Degree
5 3 (4.62%) CCIE
5 3 (4.62%) CCNP
5 3 (4.62%) Cisco Certification
6 2 (3.08%) DV Cleared
6 2 (3.08%) ITIL Certification
7 1 (1.54%) AWS Certification
7 1 (1.54%) BPSS Clearance
7 1 (1.54%) CCIE Routing and Switching
7 1 (1.54%) CEH
7 1 (1.54%) CISM
7 1 (1.54%) CISSP
7 1 (1.54%) Computer Science Degree
7 1 (1.54%) CPIM
7 1 (1.54%) CSSLP
7 1 (1.54%) DBS Check
Quality Assurance & Compliance
1 4 (6.15%) GDPR
2 2 (3.08%) Sarbanes-Oxley
3 1 (1.54%) ISO/IEC 27001
3 1 (1.54%) NIST
3 1 (1.54%) PMO
3 1 (1.54%) QA
System Software
1 8 (12.31%) Active Directory
2 2 (3.08%) BitLocker
2 2 (3.08%) Firmware
3 1 (1.54%) VMware Infrastructure
Systems Management
1 6 (9.23%) SCCM
2 2 (3.08%) OpenView
3 1 (1.54%) Microsoft Intune
3 1 (1.54%) Single Sign-On
3 1 (1.54%) SysTrack
Vendors
1 13 (20.00%) Microsoft
1 13 (20.00%) Oracle
2 7 (10.77%) Cisco
3 5 (7.69%) Dell
4 4 (6.15%) Fortinet
5 3 (4.62%) F5
5 3 (4.62%) HP
5 3 (4.62%) SAP
5 3 (4.62%) Splunk
6 2 (3.08%) Citrix
6 2 (3.08%) Draytek
6 2 (3.08%) IBM
6 2 (3.08%) McAfee
6 2 (3.08%) ServiceNow
6 2 (3.08%) Workday
7 1 (1.54%) Atlassian
7 1 (1.54%) Concur
7 1 (1.54%) Dynatrace
7 1 (1.54%) New Relic
7 1 (1.54%) SolarWinds