SC Cleared Job Trends in Birmingham

Security Check (SC) Clearance
West Midlands > Birmingham

The table below provides summary statistics for permanent job vacancies advertised in Birmingham with a requirement for SC Cleared qualifications. It includes a benchmarking guide to the salaries offered over the 6 months leading up to 19 October 2025, comparing them to the same period in the previous two years.

6 months to
19 Oct 2025
Same period 2024 Same period 2023
Rank 30 42 17
Rank change year-on-year +12 -25 +52
Permanent jobs citing SC Cleared 81 97 132
As % of all permanent jobs in Birmingham 6.80% 4.43% 10.20%
As % of the Qualifications category 21.89% 17.41% 32.27%
Number of salaries quoted 72 55 119
10th Percentile £52,500 £40,000 £38,856
25th Percentile £58,014 £46,500 £47,500
Median annual salary (50th Percentile) £72,500 £59,430 £60,000
Median % change year-on-year +21.99% -0.95% +6.23%
75th Percentile £73,750 £76,685 £68,750
90th Percentile £78,790 £93,750 £68,910
West Midlands median annual salary £70,000 £59,430 £57,291
% change year-on-year +17.79% +3.73% +4.16%

All Academic and Professional Certifications
Birmingham

SC Cleared falls under the Academic Qualifications and Professional Certifications category. For comparison with the information above, the following table provides summary statistics for all permanent job vacancies requiring academic qualifications or professional certifications in Birmingham.

Permanent vacancies requiring academic qualifications or professional certifications 370 557 409
As % of all permanent jobs advertised in Birmingham 31.04% 25.42% 31.61%
Number of salaries quoted 200 211 353
10th Percentile £28,250 £31,250 £32,500
25th Percentile £46,250 £40,625 £42,794
Median annual salary (50th Percentile) £59,826 £57,500 £55,500
Median % change year-on-year +4.05% +3.60% +0.91%
75th Percentile £73,750 £73,750 £68,750
90th Percentile £81,250 £93,750 £75,000
West Midlands median annual salary £55,000 £55,000 £50,000
% change year-on-year - +10.00% +6.38%

SC Cleared
Job Vacancy Trend in Birmingham

Historical trend showing the proportion of permanent IT job postings citing SC Cleared relative to all permanent IT jobs advertised in Birmingham.
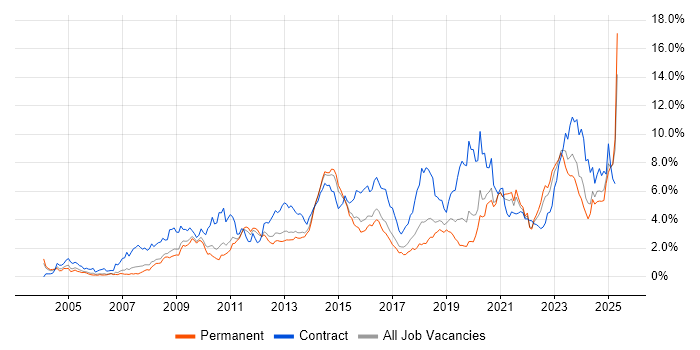
SC Cleared job vacancy trend in Birmingham

SC Cleared
Salary Trend in Birmingham

Salary distribution trend for jobs in Birmingham citing SC Cleared.

Salary distribution trend for jobs in Birmingham citing SC Cleared

SC Cleared
Salary Histogram in Birmingham

Salary distribution for jobs citing SC Cleared in Birmingham over the 6 months to 19 October 2025.

Salary histogram for SC Cleared in Birmingham

SC Cleared
Co-Occurring Skills & Capabilities in Birmingham by Category

The following tables expand on the one above by listing co-occurrences grouped by category. They cover the same employment type, locality and period, with up to 20 co-occurrences shown in each category:

Application Platforms
1 33 (40.74%) Confluence
2 5 (6.17%) nginx
3 1 (1.23%) CMS
3 1 (1.23%) Headless CMS
Applications
1 5 (6.17%) Mozilla Thunderbird
2 1 (1.23%) Navisworks
2 1 (1.23%) Revit
Business Applications
1 2 (2.47%) Integrated Workplace Management System
2 1 (1.23%) SAP S/4HANA
2 1 (1.23%) TRIRIGA
Cloud Services
1 48 (59.26%) AWS
2 36 (44.44%) Amazon S3
3 34 (41.98%) Amazon EC2
4 33 (40.74%) Amazon CloudWatch
4 33 (40.74%) AWS KMS
5 29 (35.80%) Amazon ELB
5 29 (35.80%) Virtual Private Cloud
6 24 (29.63%) Amazon Glacier
7 16 (19.75%) Azure
8 9 (11.11%) Amazon ECS
8 9 (11.11%) Route 53
9 8 (9.88%) Microsoft 365
10 5 (6.17%) GCP
11 4 (4.94%) Amazon SQS
12 3 (3.70%) Serverless
13 2 (2.47%) Amazon ECR
13 2 (2.47%) AWS Lambda
13 2 (2.47%) dbt
13 2 (2.47%) Power Platform
13 2 (2.47%) Pulumi
Communications & Networking
1 33 (40.74%) Firewall
2 17 (20.99%) DNS
3 16 (19.75%) FTP
3 16 (19.75%) HTTP
3 16 (19.75%) SMTP
3 16 (19.75%) SSH
4 10 (12.35%) ATM
4 10 (12.35%) Frame Relay
4 10 (12.35%) SDH
5 6 (7.41%) VoIP
6 5 (6.17%) IMAP
6 5 (6.17%) OpenLDAP
7 4 (4.94%) Network Security
7 4 (4.94%) WAN
8 3 (3.70%) LAN
8 3 (3.70%) VPN
9 2 (2.47%) SD-WAN
9 2 (2.47%) TCP/IP
10 1 (1.23%) BGP
10 1 (1.23%) MPLS
Database & Business Intelligence
1 36 (44.44%) Amazon RDS
2 13 (16.05%) PostgreSQL
3 10 (12.35%) Amazon Aurora
4 5 (6.17%) DynamoDB
5 2 (2.47%) Elasticsearch
5 2 (2.47%) Redis
6 1 (1.23%) Data Hub
6 1 (1.23%) Data Warehouse
6 1 (1.23%) DB2
6 1 (1.23%) MongoDB
6 1 (1.23%) NoSQL
6 1 (1.23%) SQL Server
Development Applications
1 35 (43.21%) Git
2 34 (41.98%) Jenkins
3 33 (40.74%) JIRA
4 29 (35.80%) Vagrant
5 5 (6.17%) Maven
6 4 (4.94%) Bitbucket Server
6 4 (4.94%) DbUnit
6 4 (4.94%) jMock
6 4 (4.94%) JUnit
6 4 (4.94%) Mockito
6 4 (4.94%) SonarQube
7 1 (1.23%) Cucumber
7 1 (1.23%) Gatling
7 1 (1.23%) GitLab
7 1 (1.23%) Postman
7 1 (1.23%) Selenium
7 1 (1.23%) Sonatype Nexus
7 1 (1.23%) Storybook
General
1 45 (55.56%) Public Sector
2 29 (35.80%) Social Skills
3 10 (12.35%) Inclusion and Diversity
4 6 (7.41%) Finance
5 5 (6.17%) Presentation Skills
6 3 (3.70%) Advertising
6 3 (3.70%) Analytical Skills
7 2 (2.47%) Law
7 2 (2.47%) Legal
8 1 (1.23%) Influencing Skills
8 1 (1.23%) Retail
Job Titles
1 17 (20.99%) Architect
2 16 (19.75%) DevOps Engineer
3 14 (17.28%) AWS Engineer
3 14 (17.28%) Infrastructure Engineer
3 14 (17.28%) Support Engineer
4 13 (16.05%) Infrastructure Support
4 13 (16.05%) Infrastructure Support Engineer
5 12 (14.81%) Network Architect
6 9 (11.11%) AWS Infrastructure Engineer
6 9 (11.11%) Developer
6 9 (11.11%) Lead
7 8 (9.88%) Java Developer
7 8 (9.88%) Senior
8 6 (7.41%) Lead Developer
8 6 (7.41%) Lead Java Developer
8 6 (7.41%) Platform Engineer
9 5 (6.17%) AWS DevOps
9 5 (6.17%) AWS Platform Engineer
9 5 (6.17%) Cloud Platform Engineer
9 5 (6.17%) DevOps Platform Engineer
Libraries, Frameworks & Software Standards
1 9 (11.11%) Spring
1 9 (11.11%) Spring Boot
2 7 (8.64%) AngularJS
3 6 (7.41%) EDI
3 6 (7.41%) Web Services
4 5 (6.17%) ActiveMQ
4 5 (6.17%) LDAP
4 5 (6.17%) SOAP
5 4 (4.94%) Bootstrap
5 4 (4.94%) Hibernate
5 4 (4.94%) JPA
5 4 (4.94%) PowerMock
5 4 (4.94%) React
5 4 (4.94%) RESTful
5 4 (4.94%) Spring Batch
5 4 (4.94%) Spring Integration
6 3 (3.70%) Django
7 2 (2.47%) Node.js
7 2 (2.47%) REST
8 1 (1.23%) CSS3
Miscellaneous
1 18 (22.22%) Replication
2 5 (6.17%) Cloud Native
3 4 (4.94%) Distributed Architecture
4 2 (2.47%) Data Centre
4 2 (2.47%) Distributed Systems
4 2 (2.47%) IoT
4 2 (2.47%) Management Information System
4 2 (2.47%) Operational Technology
4 2 (2.47%) Smartphone
5 1 (1.23%) AI Agents
5 1 (1.23%) Linux Command Line
5 1 (1.23%) Low-Code
5 1 (1.23%) Mobile App
5 1 (1.23%) NHS
Operating Systems
1 37 (45.68%) Linux
2 29 (35.80%) VMS
3 20 (24.69%) Windows
4 16 (19.75%) Amazon Linux
5 5 (6.17%) Ubuntu
6 2 (2.47%) Unix
Processes & Methodologies
1 38 (46.91%) DevOps
2 30 (37.04%) Change Management
3 29 (35.80%) Cloud Security
3 29 (35.80%) Configuration Management
4 17 (20.99%) Agile
4 17 (20.99%) Patch Management
4 17 (20.99%) Platform Engineering
5 14 (17.28%) Infrastructure Engineering
6 13 (16.05%) CI/CD
7 8 (9.88%) Microservices
7 8 (9.88%) TDD
8 7 (8.64%) BDD
8 7 (8.64%) Cybersecurity
8 7 (8.64%) Test Automation
9 6 (7.41%) Collaborative Culture
9 6 (7.41%) Continuous Improvement
9 6 (7.41%) Open Source
9 6 (7.41%) Performance Tuning
9 6 (7.41%) Stakeholder Management
10 5 (6.17%) Incident Response
Programming Languages
1 34 (41.98%) Python
2 29 (35.80%) Groovy
2 29 (35.80%) PowerShell
3 21 (25.93%) Java
4 11 (13.58%) Perl
5 8 (9.88%) SQL
6 5 (6.17%) TypeScript
7 4 (4.94%) JavaScript
8 2 (2.47%) C#
8 2 (2.47%) Kotlin
8 2 (2.47%) Scala
9 1 (1.23%) PL/SQL
Qualifications
1 81 (100.00%) Security Cleared
2 9 (11.11%) Degree
3 7 (8.64%) DV Cleared
4 6 (7.41%) Azure Certification
5 5 (6.17%) AWS Certification
6 3 (3.70%) CISM
6 3 (3.70%) CISSP
6 3 (3.70%) CITP
6 3 (3.70%) Computer Science Degree
7 1 (1.23%) BPSS Clearance
7 1 (1.23%) Master's Degree
7 1 (1.23%) PMI Certification
7 1 (1.23%) PMP
Quality Assurance & Compliance
1 5 (6.17%) ISO/IEC 27001
1 5 (6.17%) NIST
2 4 (4.94%) Accessibility
3 3 (3.70%) QA
4 2 (2.47%) NCSC
5 1 (1.23%) ISO 19650
5 1 (1.23%) PMO
5 1 (1.23%) WCAG
System Software
1 24 (29.63%) Active Directory
2 23 (28.40%) Docker
3 18 (22.22%) DFS Replication
4 5 (6.17%) Dovecot
4 5 (6.17%) Postfix
4 5 (6.17%) Squid
Systems Management
1 32 (39.51%) Terraform
2 29 (35.80%) Grafana
2 29 (35.80%) Prometheus
3 13 (16.05%) Ansible
4 5 (6.17%) Nessus
4 5 (6.17%) Proxmox
5 2 (2.47%) Endace
5 2 (2.47%) Kubernetes
6 1 (1.23%) AWS Copilot
Vendors
1 30 (37.04%) ServiceNow
2 16 (19.75%) Juniper
3 5 (6.17%) Cisco
3 5 (6.17%) Jaspersoft
3 5 (6.17%) Microsoft
4 4 (4.94%) Atlassian
5 3 (3.70%) Google
6 2 (2.47%) Planon
6 2 (2.47%) SAP
7 1 (1.23%) Aruba
7 1 (1.23%) Avaya
7 1 (1.23%) Fortinet
7 1 (1.23%) HP
7 1 (1.23%) IBM
7 1 (1.23%) JD Edwards
7 1 (1.23%) Oracle
7 1 (1.23%) RedGate
7 1 (1.23%) Salesforce
7 1 (1.23%) SolarWinds