Inclusion and Diversity Jobs in Birmingham

Inclusion and Diversity
West Midlands > Birmingham

The table below looks at the prevalence of the term Inclusion and Diversity in permanent job vacancies in Birmingham. Included is a benchmarking guide to the salaries offered in vacancies that cited Inclusion and Diversity over the 6 months leading up to 31 May 2025, comparing them to the same period in the previous two years.

6 months to
31 May 2025
Same period 2024 Same period 2023
Rank 32 39 87
Rank change year-on-year +7 +48 +33
Permanent jobs citing Inclusion and Diversity 97 146 47
As % of all permanent jobs advertised in Birmingham 7.17% 4.95% 2.56%
As % of the General category 11.05% 9.61% 3.85%
Number of salaries quoted 63 124 30
10th Percentile £33,500 £24,000 £34,182
25th Percentile £46,250 £31,250 £35,527
Median annual salary (50th Percentile) £57,500 £43,227 £46,118
Median % change year-on-year +33.02% -6.27% +7.57%
75th Percentile £67,500 £62,200 £65,000
90th Percentile £86,666 £68,193 £66,375
West Midlands median annual salary £57,435 £47,450 £55,000
% change year-on-year +21.04% -13.73% +17.65%

All General Skills
Birmingham

Inclusion and Diversity falls under the General Skills category. For comparison with the information above, the following table provides summary statistics for all permanent job vacancies requiring common skills in Birmingham.

Permanent vacancies with a requirement for common skills 878 1,519 1,220
As % of all permanent jobs advertised in Birmingham 64.89% 51.49% 66.56%
Number of salaries quoted 437 1,199 915
10th Percentile £31,250 £31,250 £29,750
25th Percentile £42,500 £40,000 £41,250
Median annual salary (50th Percentile) £57,500 £54,650 £55,000
Median % change year-on-year +5.22% -0.64% +4.76%
75th Percentile £73,750 £67,500 £71,250
90th Percentile £87,500 £84,964 £80,850
West Midlands median annual salary £52,500 £47,500 £52,500
% change year-on-year +10.53% -9.52% +10.53%

Inclusion and Diversity
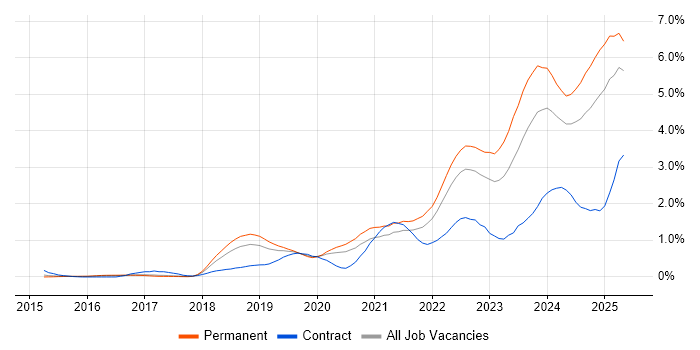
Job Vacancy Trend in Birmingham

Job postings citing Inclusion and Diversity as a proportion of all IT jobs advertised in Birmingham.

Job vacancy trend for Inclusion and Diversity in Birmingham

Inclusion and Diversity
Salary Trend in Birmingham

3-month moving average salary quoted in jobs citing Inclusion and Diversity in Birmingham.

Salary trend for Inclusion and Diversity in Birmingham

Inclusion and Diversity
Salary Histogram in Birmingham

Salary distribution for jobs citing Inclusion and Diversity in Birmingham over the 6 months to 31 May 2025.

Salary histogram for Inclusion and Diversity in Birmingham

Inclusion and Diversity
Co-occurring Skills and Capabilities in Birmingham by Category

The follow tables expand on the table above by listing co-occurrences grouped by category. The same employment type, locality and period is covered with up to 20 co-occurrences shown in each of the following categories:

Application Platforms
1 9 (9.28%) Skype for Business
2 1 (1.03%) Microsoft Exchange
2 1 (1.03%) SharePoint
Applications
1 5 (5.15%) Microsoft Excel
1 5 (5.15%) Microsoft Office
2 4 (4.12%) Microsoft PowerPoint
3 1 (1.03%) MS Visio
Business Applications
1 20 (20.62%) Oracle EBS
2 12 (12.37%) Oracle Applications
3 3 (3.09%) Sparx Enterprise Architect
4 2 (2.06%) Oracle ERP
4 2 (2.06%) PeopleSoft HCM
Cloud Services
1 30 (30.93%) Azure
2 15 (15.46%) AWS
3 6 (6.19%) Power Platform
4 5 (5.15%) Azure DevOps
4 5 (5.15%) Azure Service Bus
4 5 (5.15%) Entra ID
4 5 (5.15%) Microsoft Purview
5 4 (4.12%) Amazon EC2
5 4 (4.12%) Azure Sentinel
5 4 (4.12%) Microsoft 365
5 4 (4.12%) Route 53
6 3 (3.09%) Power Automate
6 3 (3.09%) PowerApps
6 3 (3.09%) SaaS
7 2 (2.06%) Azure Logic Apps
7 2 (2.06%) Dynamics 365
7 2 (2.06%) OCI
8 1 (1.03%) Amazon ECR
8 1 (1.03%) Amazon OpenSearch
8 1 (1.03%) Sentry
Communications & Networking
1 9 (9.28%) Skype
1 9 (9.28%) Unified Communications
1 9 (9.28%) Wireless
2 5 (5.15%) VPN
3 4 (4.12%) Firewall
3 4 (4.12%) HTTP
3 4 (4.12%) HTTPS
3 4 (4.12%) SD-WAN
3 4 (4.12%) VLAN
3 4 (4.12%) WAN
4 3 (3.09%) Network Security
5 2 (2.06%) MPLS
5 2 (2.06%) VoIP
6 1 (1.03%) IPsec
6 1 (1.03%) TCP/IP
Database & Business Intelligence
1 6 (6.19%) Oracle Database
2 5 (5.15%) Power BI
3 4 (4.12%) Metadata
3 4 (4.12%) Oracle Exadata
3 4 (4.12%) SQL Server
4 3 (3.09%) Data Warehouse
5 2 (2.06%) Amazon Redshift
6 1 (1.03%) Amazon RDS
6 1 (1.03%) Elasticsearch
6 1 (1.03%) PostgreSQL
6 1 (1.03%) Redis
Development Applications
1 6 (6.19%) Git
1 6 (6.19%) JIRA
2 4 (4.12%) JUnit
2 4 (4.12%) NUnit
3 3 (3.09%) ERwin
4 2 (2.06%) Mocha
General
1 28 (28.87%) Social Skills
2 16 (16.49%) Analytical Skills
3 11 (11.34%) Finance
4 7 (7.22%) Public Sector
5 5 (5.15%) Legal
6 4 (4.12%) Law
6 4 (4.12%) Presentation Skills
7 2 (2.06%) Billing
7 2 (2.06%) Telecoms
8 1 (1.03%) Banking
8 1 (1.03%) Documentation Skills
8 1 (1.03%) Games
8 1 (1.03%) Influencing Skills
8 1 (1.03%) Retail
Job Titles
1 16 (16.49%) Senior
2 13 (13.40%) Lead
3 10 (10.31%) Developer
4 9 (9.28%) Collaboration Specialist
5 8 (8.25%) Applications Support
5 8 (8.25%) Architect
5 8 (8.25%) Consultant
6 6 (6.19%) Applications Engineer
6 6 (6.19%) Applications Support Engineer
6 6 (6.19%) C# Developer
6 6 (6.19%) IT Consultant
6 6 (6.19%) Support Engineer
7 5 (5.15%) .NET Developer
7 5 (5.15%) Analyst
7 5 (5.15%) C# .NET Developer
7 5 (5.15%) Senior Architect
7 5 (5.15%) Senior Solutions Architect
7 5 (5.15%) Solutions Architect
8 4 (4.12%) Azure Engineer
8 4 (4.12%) Cloud Infrastructure Engineer
Libraries, Frameworks & Software Standards
1 16 (16.49%) Oracle Fusion
2 14 (14.43%) Middleware
3 11 (11.34%) EDI
4 8 (8.25%) .NET
5 6 (6.19%) .NET Core
5 6 (6.19%) Jest
5 6 (6.19%) Node.js
5 6 (6.19%) React
6 5 (5.15%) REST
7 4 (4.12%) Oracle GoldenGate
8 2 (2.06%) Kafka
8 2 (2.06%) RESTful
8 2 (2.06%) Tailwind CSS
9 1 (1.03%) Django
9 1 (1.03%) YAML
Miscellaneous
1 13 (13.40%) Management Information System
2 9 (9.28%) Digital Signage
2 9 (9.28%) Video Conferencing
3 5 (5.15%) Driving Licence
4 3 (3.09%) Renewable Energy
4 3 (3.09%) SCADA
5 2 (2.06%) CCTV
5 2 (2.06%) Cloud Native
5 2 (2.06%) Enterprise Software
5 2 (2.06%) Public Cloud
5 2 (2.06%) Virtual Team
6 1 (1.03%) Data Centre
6 1 (1.03%) Distributed Systems
6 1 (1.03%) Hybrid Cloud
6 1 (1.03%) Linux Command Line
6 1 (1.03%) Self-Motivation
Operating Systems
1 14 (14.43%) Windows
2 6 (6.19%) Linux
3 5 (5.15%) Unix
3 5 (5.15%) Windows Server
4 1 (1.03%) Oracle Linux
4 1 (1.03%) Windows 10
Processes & Methodologies
1 25 (25.77%) Stakeholder Management
2 21 (21.65%) Problem-Solving
3 17 (17.53%) Agile
4 16 (16.49%) Mentoring
5 15 (15.46%) ITIL
6 14 (14.43%) Analytics
6 14 (14.43%) DevOps
7 12 (12.37%) Stakeholder Engagement
8 11 (11.34%) Data Management
9 10 (10.31%) Business Transformation
9 10 (10.31%) Continuous Improvement
9 10 (10.31%) Incident Management
9 10 (10.31%) Project Management
9 10 (10.31%) Service Delivery
9 10 (10.31%) User Experience
10 9 (9.28%) Business Strategy
11 8 (8.25%) CI/CD
11 8 (8.25%) Cost Reduction
12 7 (7.22%) People Management
12 7 (7.22%) Proactive Monitoring
Programming Languages
1 17 (17.53%) SQL
2 6 (6.19%) C#
3 4 (4.12%) PL/SQL
3 4 (4.12%) PowerShell
3 4 (4.12%) Shell Script
4 2 (2.06%) JavaScript
4 2 (2.06%) PHP
5 1 (1.03%) Python
Qualifications
1 12 (12.37%) Degree
2 7 (7.22%) Microsoft Certification
3 5 (5.15%) CITP
3 5 (5.15%) Oracle Certification
3 5 (5.15%) SC Cleared
3 5 (5.15%) Security Cleared
4 4 (4.12%) AWS Certification
4 4 (4.12%) Azure Certification
4 4 (4.12%) CompTIA Security+
4 4 (4.12%) DBS Check
4 4 (4.12%) MRICS
4 4 (4.12%) OCA
4 4 (4.12%) OCP
5 2 (2.06%) Chartered Engineer
5 2 (2.06%) HNC
5 2 (2.06%) HND
5 2 (2.06%) Master's Degree
6 1 (1.03%) ITIL Foundation Certificate
6 1 (1.03%) MCSA
Quality Assurance & Compliance
1 4 (4.12%) Accessibility
2 2 (2.06%) Data Quality
2 2 (2.06%) ISO/IEC 27001
2 2 (2.06%) NCSC
2 2 (2.06%) NIST
3 1 (1.03%) GDPR
3 1 (1.03%) QA
System Software
1 10 (10.31%) Active Directory
2 4 (4.12%) Virtual Machines
3 1 (1.03%) Docker
3 1 (1.03%) Virtual Desktop
Systems Management
1 5 (5.15%) Microsoft Intune
2 4 (4.12%) Oracle RMAN
3 2 (2.06%) Cisco CUCM
3 2 (2.06%) Terraform
4 1 (1.03%) Ansible
4 1 (1.03%) AWS Copilot
4 1 (1.03%) Single Sign-On
Vendors
1 31 (31.96%) Microsoft
2 20 (20.62%) Oracle
3 14 (14.43%) Cisco
4 12 (12.37%) ServiceNow
5 9 (9.28%) Mitel
5 9 (9.28%) Polycom
5 9 (9.28%) ShoreTel
6 7 (7.22%) YouTube
7 4 (4.12%) NEC
7 4 (4.12%) Okta
7 4 (4.12%) SAP
8 3 (3.09%) Facebook
8 3 (3.09%) Informatica
8 3 (3.09%) Sparx
9 2 (2.06%) Google
9 2 (2.06%) Hyperion
9 2 (2.06%) JD Edwards
9 2 (2.06%) PeopleSoft
10 1 (1.03%) Citrix
10 1 (1.03%) Meraki