CI/CD Jobs in Birmingham

CI/CD
West Midlands > Birmingham

The table below provides summary statistics for permanent job vacancies advertised in Birmingham requiring CI/CD skills. It includes a benchmarking guide to the annual salaries offered in vacancies that cited CI/CD over the 6 months leading up to 30 May 2025, comparing them to the same period in the previous two years.

6 months to
30 May 2025
Same period 2024 Same period 2023
Rank 56 48 35
Rank change year-on-year -8 -13 +12
Permanent jobs citing CI/CD 55 120 125
As % of all permanent jobs advertised in Birmingham 4.12% 4.08% 6.72%
As % of the Processes & Methodologies category 4.31% 5.10% 6.98%
Number of salaries quoted 40 112 105
10th Percentile £45,000 £37,625 £47,500
25th Percentile £50,313 £50,000 £53,750
Median annual salary (50th Percentile) £60,000 £72,500 £65,500
Median % change year-on-year -17.24% +10.69% -2.96%
75th Percentile £74,375 £95,000 £80,000
90th Percentile £88,125 £105,000 £95,000
West Midlands median annual salary £60,000 £65,000 £65,000
% change year-on-year -7.69% - -

All Process and Methodology Skills
Birmingham

CI/CD falls under the Processes and Methodologies category. For comparison with the information above, the following table provides summary statistics for all permanent job vacancies requiring process or methodology skills in Birmingham.

Permanent vacancies with a requirement for process or methodology skills 1,276 2,355 1,792
As % of all permanent jobs advertised in Birmingham 95.51% 80.02% 96.40%
Number of salaries quoted 686 1,895 1,337
10th Percentile £32,500 £32,000 £32,426
25th Percentile £42,500 £40,988 £42,750
Median annual salary (50th Percentile) £55,000 £55,000 £56,500
Median % change year-on-year - -2.65% +2.73%
75th Percentile £68,750 £70,000 £71,250
90th Percentile £83,125 £85,000 £82,500
West Midlands median annual salary £52,500 £50,000 £52,500
% change year-on-year +5.00% -4.76% +5.00%

CI/CD
Job Vacancy Trend in Birmingham

Job postings citing CI/CD as a proportion of all IT jobs advertised in Birmingham.
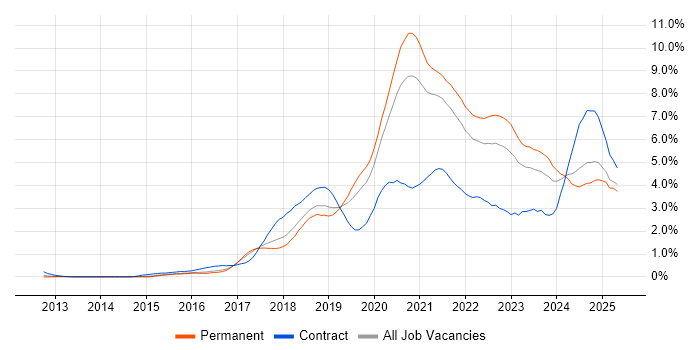
Job vacancy trend for CI/CD in Birmingham

CI/CD
Salary Trend in Birmingham

3-month moving average salary quoted in jobs citing CI/CD in Birmingham.

Salary trend for CI/CD in Birmingham

CI/CD
Salary Histogram in Birmingham

Salary distribution for jobs citing CI/CD in Birmingham over the 6 months to 30 May 2025.

Salary histogram for CI/CD in Birmingham

CI/CD
Co-occurring Skills and Capabilities in Birmingham by Category

The follow tables expand on the table above by listing co-occurrences grouped by category. The same employment type, locality and period is covered with up to 20 co-occurrences shown in each of the following categories:

Application Platforms
1 10 (18.18%) Confluence
2 3 (5.45%) CMS
2 3 (5.45%) Headless CMS
2 3 (5.45%) nginx
3 1 (1.82%) Apache Solr
3 1 (1.82%) OpenStack
Applications
1 3 (5.45%) Microsoft Excel
2 2 (3.64%) Mozilla Thunderbird
Business Applications
1 6 (10.91%) Oracle EBS
2 2 (3.64%) Dynamics CRM
3 1 (1.82%) Salesforce CRM
3 1 (1.82%) Shopify
Cloud Services
1 26 (47.27%) Azure
2 15 (27.27%) Azure DevOps
3 13 (23.64%) AWS
4 6 (10.91%) Figma
4 6 (10.91%) GitHub
4 6 (10.91%) Power Platform
5 5 (9.09%) Dynamics 365
5 5 (9.09%) GCP
5 5 (9.09%) SaaS
6 3 (5.45%) Amazon ECS
6 3 (5.45%) GitHub Actions
6 3 (5.45%) IaaS
6 3 (5.45%) Power Automate
6 3 (5.45%) Serverless
6 3 (5.45%) Supabase
6 3 (5.45%) Vercel
7 2 (3.64%) Azure Logic Apps
7 2 (3.64%) Azure Monitor
7 2 (3.64%) Contentful
7 2 (3.64%) PowerApps
Communications & Networking
1 6 (10.91%) HTTP
2 4 (7.27%) 3GPP
2 4 (7.27%) 5G
2 4 (7.27%) DNS
3 3 (5.45%) Firewall
4 2 (3.64%) FTP
4 2 (3.64%) IMAP
4 2 (3.64%) OpenLDAP
4 2 (3.64%) SMTP
4 2 (3.64%) SSH
4 2 (3.64%) TCP/IP
4 2 (3.64%) VPN
5 1 (1.82%) Cisco IOS
5 1 (1.82%) HTTPS
5 1 (1.82%) Internet
5 1 (1.82%) IOS XR
5 1 (1.82%) IPsec
5 1 (1.82%) SD-WAN
5 1 (1.82%) Software-Defined Networking
5 1 (1.82%) WAN
Database & Business Intelligence
1 8 (14.55%) PostgreSQL
2 6 (10.91%) NoSQL
3 5 (9.09%) MongoDB
3 5 (9.09%) MySQL
4 4 (7.27%) Power BI
4 4 (7.27%) Relational Database
4 4 (7.27%) SQL Server
5 3 (5.45%) Amazon RDS
6 2 (3.64%) Amazon Aurora
6 2 (3.64%) Azure SQL Database
7 1 (1.82%) Couchbase
7 1 (1.82%) Data Lake
7 1 (1.82%) DB2
7 1 (1.82%) Elasticsearch
7 1 (1.82%) RDBMS
7 1 (1.82%) Redis
Development Applications
1 14 (25.45%) Git
2 12 (21.82%) JIRA
3 6 (10.91%) NUnit
4 4 (7.27%) GitLab
4 4 (7.27%) Jenkins
4 4 (7.27%) JUnit
4 4 (7.27%) Selenium
5 3 (5.45%) Bitbucket
5 3 (5.45%) Postman
6 2 (3.64%) Mocha
6 2 (3.64%) SpecFlow
6 2 (3.64%) Storybook
6 2 (3.64%) Vagrant
6 2 (3.64%) WebDriver
7 1 (1.82%) Octopus Deploy
7 1 (1.82%) Robot Framework
7 1 (1.82%) Vite
General
1 21 (38.18%) Social Skills
2 8 (14.55%) Inclusion and Diversity
3 7 (12.73%) Analytical Skills
4 5 (9.09%) Automotive
4 5 (9.09%) Presentation Skills
5 4 (7.27%) Public Sector
5 4 (7.27%) Telecoms
6 3 (5.45%) Finance
7 2 (3.64%) Advertising
Job Titles
1 22 (40.00%) Developer
2 15 (27.27%) Senior
3 6 (10.91%) Senior Software Engineer
3 6 (10.91%) Software Developer
3 6 (10.91%) Software Engineer
4 5 (9.09%) C# Developer
5 4 (7.27%) Analyst
5 4 (7.27%) Backend Developer
5 4 (7.27%) DevOps Engineer
5 4 (7.27%) Lead
5 4 (7.27%) Platform Engineer
5 4 (7.27%) React Developer
5 4 (7.27%) Test Analyst
6 3 (5.45%) .NET Developer
6 3 (5.45%) Architect
6 3 (5.45%) C# .NET Developer
6 3 (5.45%) Front-End Developer (Client-Side Developer)
6 3 (5.45%) Full-Stack Developer
6 3 (5.45%) Product Manager
6 3 (5.45%) Senior Developer
Libraries, Frameworks & Software Standards
1 15 (27.27%) .NET
1 15 (27.27%) React
2 12 (21.82%) Node.js
3 6 (10.91%) .NET Core
3 6 (10.91%) Jest
4 4 (7.27%) AngularJS
4 4 (7.27%) Next.js
4 4 (7.27%) Vue
5 3 (5.45%) CSS
5 3 (5.45%) Express.js
5 3 (5.45%) FastAPI
5 3 (5.45%) HTML
5 3 (5.45%) MERN Stack
5 3 (5.45%) Middleware
5 3 (5.45%) YAML
6 2 (3.64%) GraphQL
6 2 (3.64%) Material-UI
6 2 (3.64%) MEAN Stack
6 2 (3.64%) NestJS
6 2 (3.64%) Playwright
Miscellaneous
1 6 (10.91%) Mobile App
2 5 (9.09%) Data Structures
3 4 (7.27%) Cloud Native
4 3 (5.45%) Distributed Systems
4 3 (5.45%) Lidar
5 2 (3.64%) IoT
5 2 (3.64%) NHS
5 2 (3.64%) Onboarding
5 2 (3.64%) Replication
6 1 (1.82%) Clustering
6 1 (1.82%) Data Centre
6 1 (1.82%) Data Protection Act
6 1 (1.82%) Greenfield Project
6 1 (1.82%) Hybrid Cloud
6 1 (1.82%) Linux Command Line
6 1 (1.82%) Private Cloud
6 1 (1.82%) Robotics
Operating Systems
1 9 (16.36%) Linux
2 5 (9.09%) Windows
3 3 (5.45%) Apple iOS
3 3 (5.45%) Ubuntu
4 2 (3.64%) Amazon Linux
4 2 (3.64%) VMS
5 1 (1.82%) Red Hat Enterprise Linux
5 1 (1.82%) Unix
Processes & Methodologies
1 34 (61.82%) DevOps
2 27 (49.09%) Agile
3 14 (25.45%) Problem-Solving
4 13 (23.64%) Continuous Integration
5 11 (20.00%) Scrum
6 10 (18.18%) Clean Code
7 9 (16.36%) Continuous Delivery
7 9 (16.36%) Project Management
7 9 (16.36%) SDLC
7 9 (16.36%) Software Engineering
7 9 (16.36%) User Experience
8 8 (14.55%) API Integration
8 8 (14.55%) OO
9 7 (12.73%) API Development
9 7 (12.73%) Artificial Intelligence
9 7 (12.73%) Continuous Improvement
9 7 (12.73%) Design Patterns
9 7 (12.73%) Microservices
9 7 (12.73%) Roadmaps
9 7 (12.73%) TDD
Programming Languages
1 16 (29.09%) C#
2 14 (25.45%) Python
3 12 (21.82%) SQL
4 10 (18.18%) JavaScript
5 9 (16.36%) TypeScript
6 5 (9.09%) PowerShell
7 3 (5.45%) Swift
8 2 (3.64%) Bicep
8 2 (3.64%) Groovy
8 2 (3.64%) Java
9 1 (1.82%) Apex Code
9 1 (1.82%) Bash
9 1 (1.82%) PHP
9 1 (1.82%) VB
Qualifications
1 6 (10.91%) Security Cleared
2 5 (9.09%) SC Cleared
3 4 (7.27%) Azure Certification
4 3 (5.45%) AWS Certification
4 3 (5.45%) BPSS Clearance
4 3 (5.45%) Degree
5 2 (3.64%) ISTQB
5 2 (3.64%) ISTQB Foundation Certification
6 1 (1.82%) AWS Certified Solutions Architect
6 1 (1.82%) DBS Check
Quality Assurance & Compliance
1 8 (14.55%) QA
2 5 (9.09%) NCSC
3 2 (3.64%) Data Quality
4 1 (1.82%) Cyber Essentials
4 1 (1.82%) ISO/IEC 27001
4 1 (1.82%) NIST
System Software
1 7 (12.73%) Docker
2 2 (3.64%) DFS Replication
2 2 (3.64%) Dovecot
2 2 (3.64%) Postfix
2 2 (3.64%) Squid
3 1 (1.82%) Virtual Machines
Systems Management
1 9 (16.36%) Terraform
2 7 (12.73%) Kubernetes
3 5 (9.09%) Ansible
3 5 (9.09%) Grafana
3 5 (9.09%) Prometheus
4 2 (3.64%) Nessus
4 2 (3.64%) Proxmox
5 1 (1.82%) AWS Copilot
5 1 (1.82%) Single Sign-On
Vendors
1 9 (16.36%) Microsoft
2 8 (14.55%) Oracle
3 4 (7.27%) Google
3 4 (7.27%) Okta
4 3 (5.45%) Atlassian
4 3 (5.45%) ServiceNow
5 2 (3.64%) Jaspersoft
5 2 (3.64%) OpenAI
6 1 (1.82%) Cisco
6 1 (1.82%) Databricks
6 1 (1.82%) IBM
6 1 (1.82%) Juniper
6 1 (1.82%) Meraki
6 1 (1.82%) Salesforce
6 1 (1.82%) Splunk
6 1 (1.82%) VMware