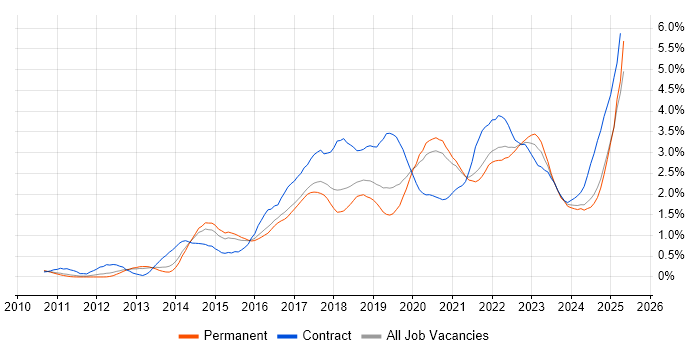
JIRA Job Trends in Birmingham

Atlassian JIRA
West Midlands > Birmingham

The table below provides summary statistics and salary benchmarking for jobs advertised in Birmingham requiring JIRA skills. It covers vacancies from the 6 months leading up to 14 September 2025, with comparisons to the same periods in the previous two years.

6 months to
14 Sep 2025
Same period 2024 Same period 2023
Rank 43 95 72
Rank change year-on-year +52 -23 +24
Permanent jobs citing JIRA 57 31 41
As % of all permanent jobs advertised in Birmingham 4.75% 1.36% 2.88%
As % of the Development Applications category 52.78% 24.80% 27.15%
Number of salaries quoted 44 21 34
10th Percentile £46,775 £40,000 £37,983
25th Percentile £55,645 £42,500 £50,000
Median annual salary (50th Percentile) £72,500 £47,501 £62,500
Median % change year-on-year +52.63% -24.00% +4.17%
75th Percentile £73,750 £62,200 £91,934
90th Percentile - - £102,152
West Midlands median annual salary £65,000 £45,000 £57,500
% change year-on-year +44.44% -21.74% +15.00%

All Development Application Skills
Birmingham

JIRA falls under the Development Applications category. For comparison with the information above, the following table provides summary statistics for all permanent job vacancies requiring development application skills in Birmingham.

Permanent vacancies with a requirement for development application skills 108 125 151
As % of all permanent jobs advertised in Birmingham 9.00% 5.48% 10.59%
Number of salaries quoted 86 63 135
10th Percentile £41,250 £40,000 £42,500
25th Percentile £44,563 £42,500 £49,375
Median annual salary (50th Percentile) £62,000 £57,500 £57,500
Median % change year-on-year +7.83% - -4.17%
75th Percentile £73,750 £70,370 £77,500
90th Percentile - £82,000 £85,000
West Midlands median annual salary £60,000 £54,500 £57,500
% change year-on-year +10.09% -5.22% +10.50%

JIRA
Job Vacancy Trend in Birmingham

Job postings citing JIRA as a proportion of all IT jobs advertised in Birmingham.

Job vacancy trend for JIRA in Birmingham

JIRA
Salary Trend in Birmingham

Salary distribution trend for jobs in Birmingham citing JIRA.

Salary distribution trend for jobs in Birmingham citing JIRA

JIRA
Salary Histogram in Birmingham

Salary distribution for jobs citing JIRA in Birmingham over the 6 months to 14 September 2025.

Salary histogram for JIRA in Birmingham

JIRA
Co-occurring Skills and Capabilities in Birmingham by Category

The follow tables expand on the table above by listing co-occurrences grouped by category. The same employment type, locality and period is covered with up to 20 co-occurrences shown in each of the following categories:

Application Platforms
1 36 (63.16%) Confluence
2 5 (8.77%) nginx
3 1 (1.75%) ColdFusion
Applications
1 5 (8.77%) Mozilla Thunderbird
2 3 (5.26%) Trello
3 2 (3.51%) Microsoft Office
3 2 (3.51%) Microsoft Project
4 1 (1.75%) Chatbot
4 1 (1.75%) Microsoft Excel
4 1 (1.75%) Microsoft PowerPoint
Business Applications
1 3 (5.26%) Sparx Enterprise Architect
2 1 (1.75%) Salesforce CRM
Cloud Services
1 33 (57.89%) Amazon CloudWatch
1 33 (57.89%) Amazon EC2
1 33 (57.89%) Amazon S3
1 33 (57.89%) AWS
1 33 (57.89%) AWS KMS
2 29 (50.88%) Amazon ELB
2 29 (50.88%) Virtual Private Cloud
3 24 (42.11%) Amazon Glacier
4 9 (15.79%) Azure
4 9 (15.79%) Route 53
5 7 (12.28%) Power Platform
6 6 (10.53%) SaaS
7 5 (8.77%) Amazon ECS
7 5 (8.77%) Microsoft 365
8 4 (7.02%) Amazon SQS
8 4 (7.02%) Dynamics 365
9 1 (1.75%) Azure DevOps
9 1 (1.75%) Figma
9 1 (1.75%) GitHub
9 1 (1.75%) Slack
Communications & Networking
1 29 (50.88%) Firewall
2 16 (28.07%) DNS
2 16 (28.07%) FTP
2 16 (28.07%) HTTP
2 16 (28.07%) SMTP
2 16 (28.07%) SSH
3 5 (8.77%) IMAP
3 5 (8.77%) OpenLDAP
Database & Business Intelligence
1 33 (57.89%) Amazon RDS
2 9 (15.79%) Amazon Aurora
2 9 (15.79%) PostgreSQL
3 7 (12.28%) Power BI
4 4 (7.02%) DynamoDB
4 4 (7.02%) Metadata
5 2 (3.51%) Amazon Redshift
6 1 (1.75%) MySQL
6 1 (1.75%) Relational Database
6 1 (1.75%) SQL Server
Development Applications
1 34 (59.65%) Git
2 33 (57.89%) Jenkins
3 29 (50.88%) Vagrant
4 4 (7.02%) Bitbucket Server
4 4 (7.02%) DbUnit
4 4 (7.02%) jMock
4 4 (7.02%) JUnit
4 4 (7.02%) Maven
4 4 (7.02%) Mockito
4 4 (7.02%) SonarQube
5 3 (5.26%) ERwin
6 2 (3.51%) Selenium
7 1 (1.75%) Sonatype Nexus
7 1 (1.75%) Subversion
General
1 34 (59.65%) Public Sector
2 14 (24.56%) Social Skills
3 6 (10.53%) Inclusion and Diversity
4 5 (8.77%) Presentation Skills
5 3 (5.26%) Analytical Skills
6 2 (3.51%) Back Office
6 2 (3.51%) Finance
6 2 (3.51%) Law
7 1 (1.75%) Games
7 1 (1.75%) Legal
7 1 (1.75%) Marketing
Job Titles
1 16 (28.07%) DevOps Engineer
2 13 (22.81%) AWS Engineer
2 13 (22.81%) Infrastructure Engineer
3 12 (21.05%) Infrastructure Support
3 12 (21.05%) Infrastructure Support Engineer
3 12 (21.05%) Support Engineer
4 10 (17.54%) Lead
5 8 (14.04%) AWS Infrastructure Engineer
6 6 (10.53%) Analyst
7 5 (8.77%) Applications Support
7 5 (8.77%) AWS DevOps
7 5 (8.77%) AWS DevOps Engineer
7 5 (8.77%) AWS Platform Engineer
7 5 (8.77%) Cloud Platform Engineer
7 5 (8.77%) DevOps Platform Engineer
7 5 (8.77%) Head of Support
7 5 (8.77%) Platform Engineer
7 5 (8.77%) Senior
8 4 (7.02%) Developer
8 4 (7.02%) Lead Developer
Libraries, Frameworks & Software Standards
1 6 (10.53%) Bootstrap
1 6 (10.53%) EDI
2 5 (8.77%) AngularJS
2 5 (8.77%) LDAP
2 5 (8.77%) RESTful
2 5 (8.77%) SOAP
2 5 (8.77%) Web Services
3 4 (7.02%) ActiveMQ
3 4 (7.02%) Hibernate
3 4 (7.02%) JPA
3 4 (7.02%) PowerMock
3 4 (7.02%) Spring
3 4 (7.02%) Spring Batch
3 4 (7.02%) Spring Boot
3 4 (7.02%) Spring Integration
4 2 (3.51%) Playwright
4 2 (3.51%) React
5 1 (1.75%) Redux
5 1 (1.75%) Tailwind CSS
5 1 (1.75%) Vue
Miscellaneous
1 18 (31.58%) Replication
2 5 (8.77%) Enterprise Software
3 4 (7.02%) Distributed Architecture
4 3 (5.26%) Management Information System
5 2 (3.51%) Product Ownership
6 1 (1.75%) Low-Code
6 1 (1.75%) NHS
6 1 (1.75%) Renewable Energy
6 1 (1.75%) Security Operations Centre
Operating Systems
1 34 (59.65%) Linux
2 29 (50.88%) VMS
3 18 (31.58%) Windows
4 16 (28.07%) Amazon Linux
5 5 (8.77%) Ubuntu
6 1 (1.75%) CentOS
6 1 (1.75%) Debian
Processes & Methodologies
1 37 (64.91%) DevOps
2 30 (52.63%) Change Management
3 29 (50.88%) Cloud Security
3 29 (50.88%) Configuration Management
4 17 (29.82%) Agile
5 16 (28.07%) Patch Management
5 16 (28.07%) Platform Engineering
6 13 (22.81%) Infrastructure Engineering
7 12 (21.05%) Stakeholder Management
8 9 (15.79%) Continuous Improvement
9 8 (14.04%) CI/CD
10 7 (12.28%) Business Intelligence
10 7 (12.28%) Incident Management
10 7 (12.28%) Kanban
10 7 (12.28%) Project Management
10 7 (12.28%) Scrum
10 7 (12.28%) Service Delivery
11 6 (10.53%) Data Management
11 6 (10.53%) Root Cause Analysis
11 6 (10.53%) Test Automation
Programming Languages
1 29 (50.88%) Groovy
1 29 (50.88%) PowerShell
1 29 (50.88%) Python
2 16 (28.07%) Java
3 11 (19.30%) Perl
4 8 (14.04%) SQL
5 2 (3.51%) C#
5 2 (3.51%) JavaScript
6 1 (1.75%) PHP
6 1 (1.75%) TypeScript
Qualifications
1 33 (57.89%) SC Cleared
1 33 (57.89%) Security Cleared
2 15 (26.32%) Degree
3 5 (8.77%) AWS Certification
3 5 (8.77%) Azure Certification
3 5 (8.77%) CITP
3 5 (8.77%) PMI Certification
3 5 (8.77%) PMP
4 4 (7.02%) ISTQB
4 4 (7.02%) ISTQB Foundation Certification
5 2 (3.51%) Microsoft Certification
Quality Assurance & Compliance
1 5 (8.77%) ISO/IEC 27001
1 5 (8.77%) QA
1 5 (8.77%) SLA
2 1 (1.75%) Data Quality
2 1 (1.75%) EMIR
2 1 (1.75%) GDPR
System Software
1 24 (42.11%) Active Directory
2 20 (35.09%) Docker
3 18 (31.58%) DFS Replication
4 5 (8.77%) Dovecot
4 5 (8.77%) Postfix
4 5 (8.77%) Squid
Systems Management
1 29 (50.88%) Grafana
1 29 (50.88%) Prometheus
1 29 (50.88%) Terraform
2 13 (22.81%) Ansible
3 5 (8.77%) Nessus
3 5 (8.77%) Proxmox
Vendors
1 30 (52.63%) ServiceNow
2 13 (22.81%) Juniper
3 9 (15.79%) Microsoft
4 5 (8.77%) Jaspersoft
5 4 (7.02%) Atlassian
6 3 (5.26%) Sparx
7 1 (1.75%) CrowdStrike
7 1 (1.75%) Red Hat
7 1 (1.75%) Salesforce