AWS Jobs in Central London

Amazon Web Services (AWS)
London > Central London

The table below provides summary statistics for permanent job vacancies advertised in Central London requiring AWS skills. It includes a benchmarking guide to the annual salaries offered in vacancies that cited AWS over the 6 months leading up to 30 April 2025, comparing them to the same period in the previous two years.

6 months to
30 Apr 2025
Same period 2024 Same period 2023
Rank 12 8 7
Rank change year-on-year -4 -1 -2
Permanent jobs citing AWS 383 660 1,033
As % of all permanent jobs advertised in Central London 15.08% 17.45% 19.50%
As % of the Cloud Services category 31.21% 34.45% 36.08%
Number of salaries quoted 296 524 909
10th Percentile £52,250 £55,000 £55,000
25th Percentile £70,000 £64,875 £65,000
Median annual salary (50th Percentile) £90,000 £80,000 £85,000
Median % change year-on-year +12.50% -5.88% +6.25%
75th Percentile £115,000 £97,500 £105,000
90th Percentile £123,125 £112,500 £115,000
London median annual salary £87,500 £85,000 £85,000
% change year-on-year +2.94% - -

All Cloud Skills
Central London

AWS falls under the Cloud Services category. For comparison with the information above, the following table provides summary statistics for all permanent job vacancies requiring cloud computing skills in Central London.

Permanent vacancies with a requirement for cloud computing skills 1,227 1,916 2,863
As % of all permanent jobs advertised in Central London 48.31% 50.65% 54.04%
Number of salaries quoted 948 1,552 2,417
10th Percentile £41,250 £41,250 £41,250
25th Percentile £55,000 £55,000 £55,000
Median annual salary (50th Percentile) £75,000 £75,000 £75,000
Median % change year-on-year - - +3.45%
75th Percentile £97,500 £95,000 £95,000
90th Percentile £120,000 £110,000 £110,000
London median annual salary £75,000 £75,000 £75,000

AWS
Job Vacancy Trend in Central London

Job postings citing AWS as a proportion of all IT jobs advertised in Central London.
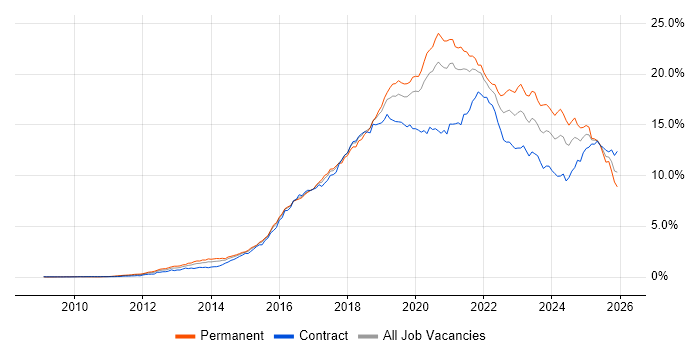
Job vacancy trend for AWS in Central London

AWS
Salary Trend in Central London

3-month moving average salary quoted in jobs citing AWS in Central London.

Salary trend for AWS in Central London

AWS
Salary Histogram in Central London

Salary distribution for jobs citing AWS in Central London over the 6 months to 30 April 2025.

Salary histogram for AWS in Central London

AWS
Job Locations in Central London

The table below looks at the demand and provides a guide to the median salaries quoted in IT jobs citing AWS within the Central London region over the 6 months to 30 April 2025. The 'Rank Change' column provides an indication of the change in demand within each location based on the same 6 month period last year.

Location Rank Change
on Same Period
Last Year
Matching
Permanent
IT Job Ads
Median Salary
Past 6 Months
Median Salary
% Change
on Same Period
Last Year
Live
Jobs
City of London -6 327 £87,500 +6.06% 111
City of Westminster -2 32 £55,000 -50.00% 2
Camden +3 14 £70,000 - 5
Southwark +4 13 £65,000 -7.14% 2
West End of London -5 11 £102,500 - 29
Lambeth - 1 £80,000 -
AWS
London

AWS
Co-occurring Skills and Capabilities in Central London by Category

The follow tables expand on the table above by listing co-occurrences grouped by category. The same employment type, locality and period is covered with up to 20 co-occurrences shown in each of the following categories:

Application Platforms
1 9 (2.35%) Microsoft Exchange
2 7 (1.83%) Apache Spark
2 7 (1.83%) Confluence
3 6 (1.57%) Apache
3 6 (1.57%) Apache Airflow
4 5 (1.31%) nginx
5 3 (0.78%) SAS
6 2 (0.52%) Tomcat
7 1 (0.26%) Alfresco
7 1 (0.26%) Camunda
7 1 (0.26%) CMS
7 1 (0.26%) Ethereum
7 1 (0.26%) Headless CMS
7 1 (0.26%) SharePoint
7 1 (0.26%) Solana
7 1 (0.26%) WordPress
Applications
1 2 (0.52%) Microsoft Excel
1 2 (0.52%) Microsoft Office
2 1 (0.26%) MS Visio
Business Applications
1 12 (3.13%) Dynamics CRM
2 6 (1.57%) Endur
3 3 (0.78%) SimCorp Dimension
4 1 (0.26%) Payment Gateway
Cloud Services
1 155 (40.47%) Azure
2 82 (21.41%) GCP
3 71 (18.54%) SaaS
4 40 (10.44%) Serverless
5 25 (6.53%) AWS CloudFormation
6 22 (5.74%) GitHub
7 21 (5.48%) Amazon S3
7 21 (5.48%) Cloud Computing
8 20 (5.22%) Power Platform
9 17 (4.44%) AWS Lambda
10 16 (4.18%) Amazon EKS
11 15 (3.92%) Amazon ECS
12 13 (3.39%) Microsoft 365
13 12 (3.13%) Azure DevOps
14 11 (2.87%) Amazon EC2
14 11 (2.87%) Snowflake
15 10 (2.61%) GitHub Actions
15 10 (2.61%) PaaS
16 7 (1.83%) AWS Step Functions
16 7 (1.83%) Pulumi
Communications & Networking
1 12 (3.13%) DNS
2 9 (2.35%) HTTP
3 7 (1.83%) WAN
4 6 (1.57%) DHCP
4 6 (1.57%) LAN
5 5 (1.31%) TCP/IP
6 4 (1.04%) Firewall
6 4 (1.04%) VPN
6 4 (1.04%) Wireless
7 3 (0.78%) Internet
7 3 (0.78%) SAN
7 3 (0.78%) VLAN
7 3 (0.78%) Wi-Fi
8 2 (0.52%) Multicast
8 2 (0.52%) NetScaler
8 2 (0.52%) SD-WAN
8 2 (0.52%) VoIP
9 1 (0.26%) Cisco Firepower
9 1 (0.26%) IP Telephony
9 1 (0.26%) Structured Cabling
Database & Business Intelligence
1 45 (11.75%) PostgreSQL
2 36 (9.40%) NoSQL
3 27 (7.05%) MongoDB
4 22 (5.74%) MySQL
5 20 (5.22%) Data Warehouse
6 11 (2.87%) DynamoDB
6 11 (2.87%) Tableau
7 10 (2.61%) Elasticsearch
7 10 (2.61%) Power BI
7 10 (2.61%) Relational Database
8 9 (2.35%) Amazon Redshift
8 9 (2.35%) Redis
9 8 (2.09%) Data Lake
9 8 (2.09%) SQL Server
10 7 (1.83%) Amazon QuickSight
10 7 (1.83%) Big Data
11 5 (1.31%) Amazon RDS
12 4 (1.04%) Data Vault
12 4 (1.04%) Metadata
12 4 (1.04%) Semantic Layer
Development Applications
1 29 (7.57%) Git
2 15 (3.92%) JIRA
3 11 (2.87%) Jenkins
4 9 (2.35%) Bitbucket
5 8 (2.09%) GitLab
6 7 (1.83%) CircleCI
7 6 (1.57%) Maven
8 5 (1.31%) Gradle
9 3 (0.78%) Atlassian Bamboo
9 3 (0.78%) Cypress.io
9 3 (0.78%) Selenium
10 1 (0.26%) Babel
10 1 (0.26%) Eclipse
10 1 (0.26%) gulp
10 1 (0.26%) JMeter
10 1 (0.26%) Storybook
10 1 (0.26%) Team Foundation Server
10 1 (0.26%) Vagrant
10 1 (0.26%) webpack
General
1 105 (27.42%) Social Skills
2 77 (20.10%) Finance
3 35 (9.14%) Analytical Skills
4 29 (7.57%) Banking
5 21 (5.48%) Games
6 19 (4.96%) Front Office
7 15 (3.92%) Investment Banking
8 14 (3.66%) Inclusion and Diversity
9 13 (3.39%) Law
10 12 (3.13%) Retail
11 9 (2.35%) Advertising
12 8 (2.09%) Marketing
13 6 (1.57%) Back Office
14 5 (1.31%) Documentation Skills
14 5 (1.31%) Legal
14 5 (1.31%) Manufacturing
14 5 (1.31%) Turkish Language
15 4 (1.04%) Electronics
15 4 (1.04%) Humanities
16 3 (0.78%) Telecoms
Job Titles
1 119 (31.07%) Senior
2 68 (17.75%) Developer
3 58 (15.14%) Lead
4 47 (12.27%) Full-Stack Engineer
5 35 (9.14%) Software Engineer
6 25 (6.53%) Architect
6 25 (6.53%) Data Engineer
7 24 (6.27%) Senior Developer
8 23 (6.01%) Senior Full-Stack Engineer
9 17 (4.44%) Senior Software Engineer
10 14 (3.66%) Platform Engineer
11 13 (3.39%) Python Developer
11 13 (3.39%) Systems Engineer
12 12 (3.13%) Cloud Engineer
12 12 (3.13%) Lead Software Engineer
13 11 (2.87%) DevOps Engineer
13 11 (2.87%) Lead Data Engineer
14 10 (2.61%) AWS Developer
14 10 (2.61%) Java Developer
14 10 (2.61%) Solutions Architect
Libraries, Frameworks & Software Standards
1 102 (26.63%) React
2 44 (11.49%) REST
3 39 (10.18%) Node.js
4 31 (8.09%) Django
5 29 (7.57%) Kafka
6 23 (6.01%) Next.js
7 22 (5.74%) RabbitMQ
8 19 (4.96%) .NET
8 19 (4.96%) RESTful
9 18 (4.70%) Spring
10 14 (3.66%) GraphQL
11 13 (3.39%) AngularJS
12 12 (3.13%) ARM Templates
12 12 (3.13%) Flask
13 10 (2.61%) JSON
13 10 (2.61%) Pandas
13 10 (2.61%) Web Services
14 9 (2.35%) Elastic Stack
14 9 (2.35%) HTML
15 8 (2.09%) CSS
Miscellaneous
1 38 (9.92%) Cloud Native
2 15 (3.92%) Greenfield Project
3 11 (2.87%) Fixed Income
3 11 (2.87%) Legacy Systems
4 10 (2.61%) Data Centre
4 10 (2.61%) Mobile Games
4 10 (2.61%) Public Cloud
5 9 (2.35%) Management Information System
5 9 (2.35%) Mobile App
6 8 (2.09%) Enterprise Software
7 7 (1.83%) Distributed Systems
7 7 (1.83%) Linux Command Line
7 7 (1.83%) Onboarding
7 7 (1.83%) Product Ownership
7 7 (1.83%) Reinsurance
8 5 (1.31%) Algorithms
8 5 (1.31%) Cyberattack
8 5 (1.31%) Hybrid Cloud
9 4 (1.04%) Robotics
9 4 (1.04%) SCADA
Operating Systems
1 41 (10.70%) Linux
2 28 (7.31%) Windows
3 16 (4.18%) Windows Server
4 6 (1.57%) Android
5 4 (1.04%) CentOS
5 4 (1.04%) Windows 10
5 4 (1.04%) Windows Server 2012
6 3 (0.78%) Windows 7
7 2 (0.52%) Mac OS X
7 2 (0.52%) Red Hat Enterprise Linux
7 2 (0.52%) Rocky
7 2 (0.52%) Unix
7 2 (0.52%) Windows Server 2008
7 2 (0.52%) Windows Server 2016
8 1 (0.26%) Apple iOS
8 1 (0.26%) Mac OS
8 1 (0.26%) Ubuntu
8 1 (0.26%) Windows Server 2019
Processes & Methodologies
1 111 (28.98%) Software Engineering
2 105 (27.42%) DevOps
3 104 (27.15%) Problem-Solving
4 90 (23.50%) Agile
5 78 (20.37%) CI/CD
6 75 (19.58%) Artificial Intelligence
7 71 (18.54%) Roadmaps
8 69 (18.02%) Full-Stack Development
9 67 (17.49%) Microservices
10 57 (14.88%) Computer Science
11 55 (14.36%) Mentoring
12 54 (14.10%) Analytics
12 54 (14.10%) Infrastructure as Code
13 50 (13.05%) Containerisation
14 44 (11.49%) Product Roadmap
15 39 (10.18%) Data Science
16 35 (9.14%) User Experience
17 32 (8.36%) ETL
18 30 (7.83%) Code Quality
19 29 (7.57%) Continuous Improvement
Programming Languages
1 202 (52.74%) Python
2 100 (26.11%) TypeScript
3 79 (20.63%) SQL
4 75 (19.58%) Java
5 55 (14.36%) JavaScript
6 20 (5.22%) Bash
6 20 (5.22%) PowerShell
7 19 (4.96%) C#
8 16 (4.18%) Go
9 13 (3.39%) Scala
10 11 (2.87%) Rust
11 10 (2.61%) R
12 8 (2.09%) PHP
13 7 (1.83%) Ruby
14 6 (1.57%) C++
15 5 (1.31%) C
16 3 (0.78%) Apex Code
16 3 (0.78%) MATLAB
17 2 (0.52%) Kotlin
17 2 (0.52%) SOQL
Qualifications
1 81 (21.15%) Degree
2 52 (13.58%) Computer Science Degree
3 19 (4.96%) AWS Certification
4 15 (3.92%) DBS Check
5 14 (3.66%) Microsoft Certification
6 11 (2.87%) Azure Certification
6 11 (2.87%) Master's Degree
7 10 (2.61%) AWS Certified Solutions Architect
7 10 (2.61%) Security Cleared
8 7 (1.83%) Numerate Degree
9 5 (1.31%) DV Cleared
9 5 (1.31%) SC Cleared
10 4 (1.04%) Cisco Certification
10 4 (1.04%) CISSP
10 4 (1.04%) MCSA
10 4 (1.04%) Postgraduate
11 3 (0.78%) CCNA
11 3 (0.78%) CISM
12 2 (0.52%) ACCA
12 2 (0.52%) CIMA
Quality Assurance & Compliance
1 16 (4.18%) SLA
2 11 (2.87%) QA
3 8 (2.09%) GDPR
4 5 (1.31%) NIST
5 4 (1.04%) ISO/IEC 27001
6 3 (0.78%) Data Quality
6 3 (0.78%) PCI DSS
7 2 (0.52%) HIPAA
7 2 (0.52%) SOC 2
8 1 (0.26%) Actionable Recommendations
8 1 (0.26%) California Consumer Privacy Act
8 1 (0.26%) COBIT
8 1 (0.26%) NCSC
8 1 (0.26%) Solvency II
System Software
1 63 (16.45%) Docker
2 21 (5.48%) Active Directory
3 13 (3.39%) VMware Infrastructure
4 5 (1.31%) Hyper-V
5 2 (0.52%) VMware ESXi
6 1 (0.26%) Apache ZooKeeper
6 1 (0.26%) Virtual Desktop
Systems Management
1 65 (16.97%) Kubernetes
2 60 (15.67%) Terraform
3 37 (9.66%) Ansible
4 11 (2.87%) Grafana
5 10 (2.61%) Prometheus
6 8 (2.09%) Argo
7 7 (1.83%) Progress Chef
8 6 (1.57%) Nagios
8 6 (1.57%) Single Sign-On
9 5 (1.31%) Active Directory Federation Services
9 5 (1.31%) Consul
9 5 (1.31%) Microsoft Intune
9 5 (1.31%) Puppet
10 4 (1.04%) Istio
11 3 (0.78%) SCCM
12 2 (0.52%) Avamar
12 2 (0.52%) Packer
12 2 (0.52%) Red Hat Satellite
13 1 (0.26%) FortiGate
13 1 (0.26%) NetBackup
Vendors
1 46 (12.01%) Microsoft
2 41 (10.70%) Google
3 18 (4.70%) VMware
4 8 (2.09%) Databricks
4 8 (2.09%) New Relic
4 8 (2.09%) Ping Identity
5 7 (1.83%) Salesforce
6 6 (1.57%) Splunk
7 5 (1.31%) Cisco
7 5 (1.31%) Citrix
7 5 (1.31%) Oracle
7 5 (1.31%) Red Hat
7 5 (1.31%) Solace
8 4 (1.04%) Hitachi
8 4 (1.04%) Informatica
8 4 (1.04%) MuleSoft
9 3 (0.78%) Commvault
9 3 (0.78%) Dell
9 3 (0.78%) OpenAI
9 3 (0.78%) SimCorp