PowerShell Job Trends in Central London

Windows PowerShell
London > Central London

The table below provides summary statistics and salary benchmarking for jobs advertised in Central London requiring PowerShell skills. It covers vacancies from the 6 months leading up to 18 September 2025, with comparisons to the same periods in the previous two years.

6 months to
18 Sep 2025
Same period 2024 Same period 2023
Rank 57 47 44
Rank change year-on-year -10 -3 +29
Permanent jobs citing PowerShell 94 178 208
As % of all permanent jobs advertised in Central London 4.73% 5.39% 5.65%
As % of the Programming Languages category 11.60% 12.01% 11.24%
Number of salaries quoted 85 131 172
10th Percentile £43,250 £55,000 £42,500
25th Percentile £56,250 £62,500 £53,750
Median annual salary (50th Percentile) £77,500 £73,750 £70,000
Median % change year-on-year +5.08% +5.36% -
75th Percentile £85,000 £87,500 £82,813
90th Percentile £104,500 £95,000 £95,000
London median annual salary £72,500 £75,000 £70,000
% change year-on-year -3.33% +7.14% -

All Programming Languages
Central London

PowerShell falls under the Programming Languages category. For comparison with the information above, the following table provides summary statistics for all permanent job vacancies requiring coding skills in Central London.

Permanent vacancies with a requirement for coding skills 810 1,482 1,850
As % of all permanent jobs advertised in Central London 40.72% 44.91% 50.22%
Number of salaries quoted 678 1,019 1,719
10th Percentile £52,500 £48,750 £48,950
25th Percentile £62,500 £56,250 £57,500
Median annual salary (50th Percentile) £80,000 £75,000 £77,500
Median % change year-on-year +6.67% -3.23% +3.33%
75th Percentile £110,000 £95,000 £100,000
90th Percentile £131,625 £112,500 £118,250
London median annual salary £80,000 £82,500 £80,000
% change year-on-year -3.03% +3.13% +6.67%

PowerShell
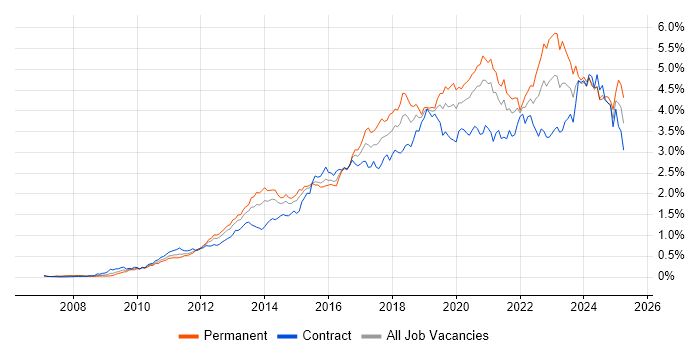
Job Vacancy Trend in Central London

Job postings citing PowerShell as a proportion of all IT jobs advertised in Central London.

Job vacancy trend for PowerShell in Central London

PowerShell
Salary Trend in Central London

Salary distribution trend for jobs in Central London citing PowerShell.

Salary distribution trend for jobs in Central London citing PowerShell

PowerShell
Salary Histogram in Central London

Salary distribution for jobs citing PowerShell in Central London over the 6 months to 18 September 2025.

Salary histogram for PowerShell in Central London

PowerShell
Job Locations in Central London

The table below looks at the demand and provides a guide to the median salaries quoted in IT jobs citing PowerShell within the Central London region over the 6 months to 18 September 2025. The 'Rank Change' column provides an indication of the change in demand within each location based on the same 6 month period last year.

Location Rank Change
on Same Period
Last Year
Matching
Permanent
IT Job Ads
Median Salary
Past 6 Months
Median Salary
% Change
on Same Period
Last Year
Live
Jobs
City of London -18 71 £72,500 -1.69% 23
West End of London +23 2 £55,750 +1.36% 1
Southwark - 1 £102,000 - 1
PowerShell
London

PowerShell
Co-occurring Skills and Capabilities in Central London by Category

The follow tables expand on the table above by listing co-occurrences grouped by category. The same employment type, locality and period is covered with up to 20 co-occurrences shown in each of the following categories:

Application Platforms
1 24 (25.53%) Microsoft Exchange
2 9 (9.57%) SharePoint
3 1 (1.06%) Confluence
3 1 (1.06%) Exchange Server 2010
3 1 (1.06%) IIS
3 1 (1.06%) SharePoint Server
Applications
1 1 (1.06%) Microsoft Office
Business Applications
1 3 (3.19%) Fidessa
2 1 (1.06%) Elite 3E
Cloud Services
1 55 (58.51%) Azure
2 50 (53.19%) Microsoft 365
3 42 (44.68%) Entra ID
4 14 (14.89%) Power Platform
5 11 (11.70%) AWS
5 11 (11.70%) Power Automate
6 9 (9.57%) Azure DevOps
7 7 (7.45%) GitHub
8 6 (6.38%) Azure Monitor
8 6 (6.38%) Google Workspace
8 6 (6.38%) PaaS
8 6 (6.38%) PowerApps
9 5 (5.32%) OpenShift
10 4 (4.26%) Datadog
10 4 (4.26%) GitHub Actions
10 4 (4.26%) Nutanix
11 3 (3.19%) Azure Logic Apps
11 3 (3.19%) dbt
11 3 (3.19%) OneDrive
11 3 (3.19%) Snowflake
Communications & Networking
1 20 (21.28%) LAN
1 20 (21.28%) WAN
2 19 (20.21%) Firewall
3 17 (18.09%) TCP/IP
4 16 (17.02%) DHCP
4 16 (17.02%) DNS
5 13 (13.83%) Network Security
6 10 (10.64%) VoIP
7 9 (9.57%) VLAN
8 7 (7.45%) Wireless
9 6 (6.38%) SSL
9 6 (6.38%) VPN
10 3 (3.19%) Kerberos
10 3 (3.19%) NetScaler
11 2 (2.13%) SAN
12 1 (1.06%) NAS
Database & Business Intelligence
1 10 (10.64%) SQL Server
2 9 (9.57%) Power BI
3 3 (3.19%) Data Mining
3 3 (3.19%) Data Warehouse
3 3 (3.19%) SQL Server Integration Services
4 1 (1.06%) Amazon RDS
4 1 (1.06%) Azure SQL Database
4 1 (1.06%) Metadata
4 1 (1.06%) MySQL
4 1 (1.06%) PostgreSQL
Development Applications
1 4 (4.26%) Git
1 4 (4.26%) JIRA
2 2 (2.13%) CircleCI
2 2 (2.13%) Jenkins
2 2 (2.13%) Visual Studio Code
3 1 (1.06%) GitLab
3 1 (1.06%) Vagrant
General
1 43 (45.74%) Social Skills
2 42 (44.68%) Finance
3 18 (19.15%) Legal
4 9 (9.57%) Banking
5 7 (7.45%) Analytical Skills
6 6 (6.38%) Organisational Skills
7 3 (3.19%) Financial Institution
7 3 (3.19%) Inclusion and Diversity
7 3 (3.19%) International Banking
8 1 (1.06%) Advertising
8 1 (1.06%) Investment Banking
8 1 (1.06%) Public Sector
8 1 (1.06%) Spanish Language
Job Titles
1 21 (22.34%) Infrastructure Engineer
2 15 (15.96%) Systems Engineer
2 15 (15.96%) Windows Engineer
3 12 (12.77%) Senior
4 11 (11.70%) Windows Systems Engineer
5 8 (8.51%) Analyst
5 8 (8.51%) DevOps Engineer
6 7 (7.45%) IT Engineer
6 7 (7.45%) Lead
7 6 (6.38%) IT Support
7 6 (6.38%) Security Engineer
8 5 (5.32%) 2nd/3rd Line Support
8 5 (5.32%) 3rd Line Support
8 5 (5.32%) Administrator
8 5 (5.32%) Junior
9 4 (4.26%) Azure Engineer
9 4 (4.26%) IT Infrastructure Engineer
9 4 (4.26%) Windows Infrastructure Engineer
10 3 (3.19%) Microsoft 365 Administrator
10 3 (3.19%) Platform Engineer
Libraries, Frameworks & Software Standards
1 3 (3.19%) .NET
1 3 (3.19%) LDAP
1 3 (3.19%) OAuth
1 3 (3.19%) OpenID
1 3 (3.19%) React
1 3 (3.19%) SailPoint
1 3 (3.19%) SAML
1 3 (3.19%) YAML
2 2 (2.13%) Microsoft Graph
2 2 (2.13%) REST
3 1 (1.06%) .NET Core
3 1 (1.06%) AngularJS
3 1 (1.06%) CSS
3 1 (1.06%) HTML
3 1 (1.06%) JSON
3 1 (1.06%) RESTful
Miscellaneous
1 15 (15.96%) Hedge funds
2 13 (13.83%) Enterprise Software
3 7 (7.45%) PKI
4 6 (6.38%) Self-Motivation
5 5 (5.32%) Cloud Native
6 4 (4.26%) Management Information System
6 4 (4.26%) Onboarding
6 4 (4.26%) Public Cloud
7 3 (3.19%) Credit Risk
7 3 (3.19%) Market Risk
7 3 (3.19%) Security Posture
8 2 (2.13%) Analytical Mindset
8 2 (2.13%) Private Cloud
9 1 (1.06%) Cyber Threat
9 1 (1.06%) Data Centre
9 1 (1.06%) Driving Licence
9 1 (1.06%) Hybrid Cloud
9 1 (1.06%) iPad
9 1 (1.06%) iPhone
9 1 (1.06%) Smartphone
Operating Systems
1 50 (53.19%) Windows
2 35 (37.23%) Windows Server
3 16 (17.02%) Linux
4 15 (15.96%) Windows Server 2012
5 6 (6.38%) Windows Server 2016
6 4 (4.26%) Unix
7 3 (3.19%) VMS
8 1 (1.06%) Mac OS
8 1 (1.06%) Windows 10
8 1 (1.06%) Windows Server 2008
8 1 (1.06%) Windows Server 2019
Processes & Methodologies
1 33 (35.11%) Infrastructure Engineering
2 23 (24.47%) Disaster Recovery
3 22 (23.40%) DevOps
4 21 (22.34%) Infrastructure as Code
5 20 (21.28%) Cybersecurity
6 18 (19.15%) Agile
6 18 (19.15%) Patch Management
6 18 (19.15%) Problem-Solving
7 17 (18.09%) Collaborative Working
7 17 (18.09%) Task Automation
8 16 (17.02%) Systems Engineering
9 15 (15.96%) Batch Scripting
9 15 (15.96%) ITIL
10 14 (14.89%) Mentoring
11 13 (13.83%) Business Continuity
12 12 (12.77%) Migration
12 12 (12.77%) Test Automation
13 11 (11.70%) Continuous Improvement
13 11 (11.70%) Identity Access Management
13 11 (11.70%) Project Management
Programming Languages
1 31 (32.98%) Python
2 15 (15.96%) SQL
3 12 (12.77%) Bash
4 6 (6.38%) TypeScript
5 4 (4.26%) Java
6 3 (3.19%) C#
7 2 (2.13%) JavaScript
7 2 (2.13%) Ruby
7 2 (2.13%) Search Processing Language
7 2 (2.13%) Shell Script
8 1 (1.06%) Bicep
8 1 (1.06%) Go
8 1 (1.06%) Kusto Query Language
8 1 (1.06%) Perl
8 1 (1.06%) PHP
8 1 (1.06%) VBA
Qualifications
1 6 (6.38%) Azure Certification
1 6 (6.38%) Microsoft Certification
2 5 (5.32%) Degree
3 3 (3.19%) CISM
3 3 (3.19%) CISSP
3 3 (3.19%) Computer Science Degree
3 3 (3.19%) Security Cleared
4 2 (2.13%) AWS Certification
4 2 (2.13%) Master's Degree
4 2 (2.13%) MCSA
4 2 (2.13%) SC Cleared
5 1 (1.06%) CCENT
5 1 (1.06%) CCIE
5 1 (1.06%) CCNA
5 1 (1.06%) CCNP
5 1 (1.06%) CREST Certified
5 1 (1.06%) DV Cleared
5 1 (1.06%) ITIL Foundation Certificate
5 1 (1.06%) Network+ Certification
5 1 (1.06%) VMware Certified Professional (VCP)
Quality Assurance & Compliance
1 10 (10.64%) NIST
2 9 (9.57%) ISO/IEC 27001
3 8 (8.51%) GDPR
4 4 (4.26%) GRC
5 1 (1.06%) Cyber Essentials
5 1 (1.06%) Cyber Essentials PLUS
5 1 (1.06%) NCSC
System Software
1 46 (48.94%) Active Directory
2 16 (17.02%) VMware Infrastructure
3 10 (10.64%) Hyper-V
4 6 (6.38%) Virtual Desktop
4 6 (6.38%) XenDesktop
5 5 (5.32%) VMware ESXi
6 4 (4.26%) XenApp
7 3 (3.19%) Docker
7 3 (3.19%) vSphere
8 2 (2.13%) VMware NSX
9 1 (1.06%) KVM
9 1 (1.06%) Terminal Server
Systems Management
1 32 (34.04%) Single Sign-On
2 20 (21.28%) Microsoft Intune
3 18 (19.15%) Terraform
4 15 (15.96%) Active Directory Federation Services
5 13 (13.83%) Ansible
6 12 (12.77%) SCCM
7 8 (8.51%) Kubernetes
8 6 (6.38%) Jamf Pro
9 5 (5.32%) Autotask
10 4 (4.26%) Progress Chef
10 4 (4.26%) Prometheus
10 4 (4.26%) vCenter Server
11 3 (3.19%) QRadar
12 2 (2.13%) FortiGate
12 2 (2.13%) Grafana
12 2 (2.13%) SCOM
13 1 (1.06%) Consul
13 1 (1.06%) Packer
13 1 (1.06%) Puppet
13 1 (1.06%) Salt
Vendors
1 55 (58.51%) Microsoft
2 19 (20.21%) VMware
3 16 (17.02%) Bloomberg
4 13 (13.83%) Reuters
5 12 (12.77%) Citrix
6 11 (11.70%) Cisco
7 8 (8.51%) Google
8 6 (6.38%) Meraki
9 5 (5.32%) Salesforce
9 5 (5.32%) SonicWALL
9 5 (5.32%) Splunk
10 4 (4.26%) NetApp
10 4 (4.26%) SolarWinds
10 4 (4.26%) Veeam
11 3 (3.19%) FactSet
11 3 (3.19%) Fortinet
11 3 (3.19%) Mitel
11 3 (3.19%) Refinitiv
12 2 (2.13%) Checkmarx
13 1 (1.06%) Nintex