Linux Jobs in Central London

Linux
London > Central London

The table below provides summary statistics for permanent job vacancies advertised in Central London requiring Linux skills. It includes a benchmarking guide to the annual salaries offered in vacancies that cited Linux over the 6 months leading up to 30 April 2025, comparing them to the same period in the previous two years.

6 months to
30 Apr 2025
Same period 2024 Same period 2023
Rank 51 69 30
Rank change year-on-year +18 -39 +4
Permanent jobs citing Linux 128 146 409
As % of all permanent jobs advertised in Central London 5.04% 3.86% 7.72%
As % of the Operating Systems category 32.16% 26.07% 41.57%
Number of salaries quoted 103 108 356
10th Percentile £44,250 £44,625 £50,000
25th Percentile £52,500 £60,938 £61,250
Median annual salary (50th Percentile) £65,000 £70,250 £85,000
Median % change year-on-year -7.47% -17.35% +18.88%
75th Percentile £95,000 £98,750 £106,563
90th Percentile £114,000 £126,500 £115,000
London median annual salary £80,000 £75,000 £80,000
% change year-on-year +6.67% -6.25% +6.67%

All Operating Systems
Central London

Linux falls under the Operating Systems category. For comparison with the information above, the following table provides summary statistics for all permanent job vacancies requiring operating system skills in Central London.

Permanent vacancies with a requirement for operating system skills 398 560 984
As % of all permanent jobs advertised in Central London 15.67% 14.80% 18.57%
Number of salaries quoted 341 455 849
10th Percentile £35,000 £32,900 £32,500
25th Percentile £41,250 £42,000 £42,500
Median annual salary (50th Percentile) £56,000 £60,000 £62,500
Median % change year-on-year -6.67% -4.00% -3.85%
75th Percentile £76,250 £80,000 £90,000
90th Percentile £100,000 £106,250 £110,000
London median annual salary £65,000 £62,500 £65,000
% change year-on-year +4.00% -3.85% -

Linux
Job Vacancy Trend in Central London

Job postings citing Linux as a proportion of all IT jobs advertised in Central London.
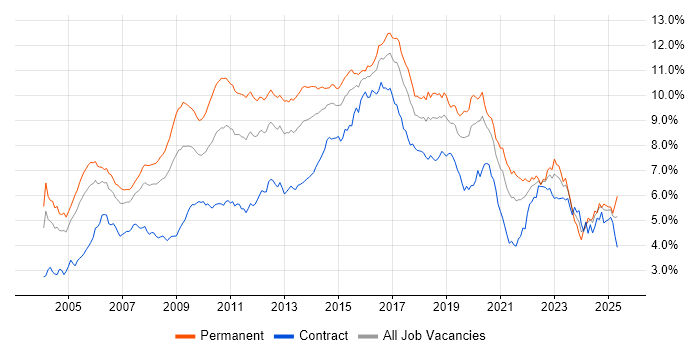
Job vacancy trend for Linux in Central London

Linux
Salary Trend in Central London

3-month moving average salary quoted in jobs citing Linux in Central London.

Salary trend for Linux in Central London

Linux
Salary Histogram in Central London

Salary distribution for jobs citing Linux in Central London over the 6 months to 30 April 2025.

Salary histogram for Linux in Central London

Linux
Job Locations in Central London

The table below looks at the demand and provides a guide to the median salaries quoted in IT jobs citing Linux within the Central London region over the 6 months to 30 April 2025. The 'Rank Change' column provides an indication of the change in demand within each location based on the same 6 month period last year.

Location Rank Change
on Same Period
Last Year
Matching
Permanent
IT Job Ads
Median Salary
Past 6 Months
Median Salary
% Change
on Same Period
Last Year
Live
Jobs
City of London +16 109 £60,000 -17.24% 38
City of Westminster -4 8 £29,250 -58.21%
Southwark -3 5 £55,000 -12.00% 2
Camden - 3 £70,000 -
West End of London -2 1 £55,000 -21.43% 3
Linux
London

Linux
Co-occurring Skills and Capabilities in Central London by Category

The follow tables expand on the table above by listing co-occurrences grouped by category. The same employment type, locality and period is covered with up to 20 co-occurrences shown in each of the following categories:

Application Platforms
1 24 (18.75%) Confluence
2 8 (6.25%) Microsoft Exchange
3 3 (2.34%) nginx
3 3 (2.34%) SharePoint
4 2 (1.56%) OpenStack
4 2 (1.56%) Tomcat
5 1 (0.78%) Alfresco
5 1 (0.78%) Apache
5 1 (0.78%) Camunda
5 1 (0.78%) CMS
5 1 (0.78%) Drupal
Applications
1 6 (4.69%) Microsoft Excel
2 5 (3.91%) Microsoft Office
3 2 (1.56%) Microsoft Project
3 2 (1.56%) MS Visio
Business Applications
1 2 (1.56%) Fidessa
Cloud Services
1 61 (47.66%) Azure
2 41 (32.03%) AWS
3 12 (9.38%) Cloud Computing
3 12 (9.38%) GCP
4 10 (7.81%) Entra ID
4 10 (7.81%) Microsoft 365
5 7 (5.47%) SaaS
6 6 (4.69%) AWS CloudFormation
7 5 (3.91%) Amazon EKS
7 5 (3.91%) GitHub
7 5 (3.91%) PaaS
8 4 (3.13%) Azure DevOps
8 4 (3.13%) Azure ExpressRoute
8 4 (3.13%) GitHub Actions
9 3 (2.34%) Amazon EC2
9 3 (2.34%) Azure AKS
10 2 (1.56%) Amazon ECR
10 2 (1.56%) Amazon ECS
10 2 (1.56%) Anthos
10 2 (1.56%) Google Kubernetes Engine
Communications & Networking
1 11 (8.59%) Firewall
2 9 (7.03%) DNS
3 7 (5.47%) VPN
4 6 (4.69%) TCP/IP
5 5 (3.91%) HTTP
5 5 (3.91%) Multicast
5 5 (3.91%) WAN
6 4 (3.13%) DHCP
6 4 (3.13%) VLAN
7 3 (2.34%) LAN
7 3 (2.34%) Network Security
8 2 (1.56%) NetScaler
8 2 (1.56%) SAN
8 2 (1.56%) SD-WAN
8 2 (1.56%) Telnet
8 2 (1.56%) Wi-Fi
9 1 (0.78%) Internet
9 1 (0.78%) SSL
9 1 (0.78%) Wireless
Database & Business Intelligence
1 10 (7.81%) MySQL
2 9 (7.03%) SQL Server
3 8 (6.25%) Elasticsearch
4 7 (5.47%) NoSQL
4 7 (5.47%) Relational Database
5 5 (3.91%) MongoDB
6 2 (1.56%) ClickHouse
6 2 (1.56%) PostgreSQL
7 1 (0.78%) Metadata
7 1 (0.78%) Redis
Development Applications
1 28 (21.88%) JIRA
2 26 (20.31%) Jenkins
3 25 (19.53%) Git
4 23 (17.97%) Maven
5 22 (17.19%) Ant
5 22 (17.19%) SonarQube
5 22 (17.19%) Sonatype Nexus
5 22 (17.19%) TeamCity
6 6 (4.69%) GitLab
7 1 (0.78%) Babel
7 1 (0.78%) Bitbucket
7 1 (0.78%) CircleCI
7 1 (0.78%) Gradle
7 1 (0.78%) gulp
7 1 (0.78%) Vite
7 1 (0.78%) webpack
General
1 38 (29.69%) Finance
2 31 (24.22%) Banking
2 31 (24.22%) Social Skills
3 13 (10.16%) Analytical Skills
4 8 (6.25%) Games
4 8 (6.25%) Inclusion and Diversity
5 5 (3.91%) Back Office
6 4 (3.13%) Investment Banking
6 4 (3.13%) Legal
7 3 (2.34%) Advertising
7 3 (2.34%) Front Office
8 2 (1.56%) Financial Institution
8 2 (1.56%) iGaming
8 2 (1.56%) Organisational Skills
8 2 (1.56%) Publishing
9 1 (0.78%) Documentation Skills
9 1 (0.78%) Fire and Rescue
9 1 (0.78%) Marketing
9 1 (0.78%) Presentation Skills
9 1 (0.78%) Retail
Job Titles
1 23 (17.97%) Architect
1 23 (17.97%) Senior
2 22 (17.19%) Developer
2 22 (17.19%) DevOps Architect
3 17 (13.28%) Infrastructure Engineer
4 13 (10.16%) Analyst
5 9 (7.03%) Lead
5 9 (7.03%) Senior Developer
5 9 (7.03%) Support Analyst
6 7 (5.47%) Software Developer
6 7 (5.47%) Support Engineer
6 7 (5.47%) Systems Engineer
6 7 (5.47%) Technical Manager
7 6 (4.69%) Applications Support
7 6 (4.69%) Banking Analyst
7 6 (4.69%) Cloud Engineer
7 6 (4.69%) Platform Engineer
8 5 (3.91%) DevOps Engineer
8 5 (3.91%) Python Developer
8 5 (3.91%) Support Manager
Libraries, Frameworks & Software Standards
1 9 (7.03%) .NET
1 9 (7.03%) FIX Protocol
1 9 (7.03%) Node.js
1 9 (7.03%) Pandas
1 9 (7.03%) REST
2 7 (5.47%) JSON
3 6 (4.69%) React
4 5 (3.91%) Django
4 5 (3.91%) Puppeteer
4 5 (3.91%) Scrapy
5 4 (3.13%) HTML
5 4 (3.13%) Middleware
6 3 (2.34%) Boost C++ Libraries
6 3 (2.34%) CSS
6 3 (2.34%) GraphQL
6 3 (2.34%) pytest
6 3 (2.34%) Vue
7 2 (1.56%) AngularJS
7 2 (1.56%) LEMP Stack
7 2 (1.56%) RESTful
Miscellaneous
1 7 (5.47%) Linux Command Line
2 6 (4.69%) Derivative
2 6 (4.69%) Equities
2 6 (4.69%) Hedge funds
3 5 (3.91%) Fixed Income
3 5 (3.91%) Self-Motivation
3 5 (3.91%) Video Conferencing
4 4 (3.13%) Cyberattack
4 4 (3.13%) Hybrid Cloud
4 4 (3.13%) Management Information System
5 3 (2.34%) Algorithms
5 3 (2.34%) Distributed Systems
5 3 (2.34%) Reference Data
5 3 (2.34%) Security Posture
6 2 (1.56%) Clustering
6 2 (1.56%) Data Centre
6 2 (1.56%) Mobile Games
6 2 (1.56%) Onboarding
6 2 (1.56%) Online Games
6 2 (1.56%) Sports Betting
Operating Systems
1 41 (32.03%) Windows
2 21 (16.41%) Unix
3 15 (11.72%) Red Hat Enterprise Linux
3 15 (11.72%) Windows Server
4 6 (4.69%) Windows Server 2016
5 5 (3.91%) CentOS
5 5 (3.91%) Windows Server 2019
6 4 (3.13%) Android
6 4 (3.13%) Rocky
7 3 (2.34%) Mac OS
7 3 (2.34%) Ubuntu
8 2 (1.56%) Solaris
8 2 (1.56%) Windows Server 2012
9 1 (0.78%) Amazon Linux
9 1 (0.78%) Windows 10
9 1 (0.78%) zOS
Processes & Methodologies
1 48 (37.50%) DevOps
2 35 (27.34%) Agile
3 30 (23.44%) Problem-Solving
4 28 (21.88%) Continuous Integration
5 27 (21.09%) CI/CD
6 23 (17.97%) Computer Science
6 23 (17.97%) Scaled Agile Framework
7 22 (17.19%) Static Code Analysis
8 19 (14.84%) Infrastructure Engineering
9 12 (9.38%) Customer Service
10 11 (8.59%) Containerisation
10 11 (8.59%) Disaster Recovery
10 11 (8.59%) Software Engineering
11 10 (7.81%) Collaborative Working
11 10 (7.81%) Fintech
11 10 (7.81%) Mentoring
12 9 (7.03%) Low Latency
12 9 (7.03%) Mathematics
13 8 (6.25%) ETL
13 8 (6.25%) High Availability
Programming Languages
1 51 (39.84%) Python
2 39 (30.47%) JavaScript
3 33 (25.78%) SQL
4 22 (17.19%) Bash
5 18 (14.06%) PowerShell
6 14 (10.94%) C++
7 13 (10.16%) Java
8 6 (4.69%) Go
9 4 (3.13%) Rust
9 4 (3.13%) T-SQL
10 2 (1.56%) Perl
10 2 (1.56%) PHP
10 2 (1.56%) Shell Script
11 1 (0.78%) R
11 1 (0.78%) Scala
11 1 (0.78%) TypeScript
Qualifications
1 23 (17.97%) Degree
2 17 (13.28%) Computer Science Degree
3 7 (5.47%) Security Cleared
4 6 (4.69%) DV Cleared
5 5 (3.91%) Microsoft Certification
6 4 (3.13%) MCSA
7 3 (2.34%) RHCSA
8 2 (1.56%) CCNA
8 2 (1.56%) Cisco Certification
9 1 (0.78%) CCNP
9 1 (0.78%) CEH
9 1 (0.78%) CISSP
9 1 (0.78%) CompTIA Security+
9 1 (0.78%) Master's Degree
9 1 (0.78%) MCSE
9 1 (0.78%) Network+ Certification
9 1 (0.78%) OSCP
9 1 (0.78%) SC Cleared
Quality Assurance & Compliance
1 8 (6.25%) QA
2 6 (4.69%) SLA
3 2 (1.56%) PMO
4 1 (0.78%) Data Quality
4 1 (0.78%) ISO 9001
4 1 (0.78%) NIST
4 1 (0.78%) Sarbanes-Oxley
System Software
1 23 (17.97%) VMware Infrastructure
2 16 (12.50%) Docker
3 15 (11.72%) Active Directory
4 9 (7.03%) VMware ESXi
5 7 (5.47%) Hyper-V
5 7 (5.47%) Virtual Desktop
6 2 (1.56%) Firmware
6 2 (1.56%) Virtual Servers
7 1 (0.78%) Apache ZooKeeper
7 1 (0.78%) Microsoft Virtual Server
7 1 (0.78%) vSphere
Systems Management
1 22 (17.19%) Ansible
2 20 (15.63%) Terraform
3 15 (11.72%) Kubernetes
4 8 (6.25%) Microsoft Intune
5 7 (5.47%) Nagios
6 6 (4.69%) Grafana
7 4 (3.13%) Single Sign-On
8 3 (2.34%) NetBackup
8 3 (2.34%) SCCM
9 2 (1.56%) Active Directory Federation Services
9 2 (1.56%) Prometheus
9 2 (1.56%) Red Hat Satellite
9 2 (1.56%) vCenter Server
10 1 (0.78%) Avamar
10 1 (0.78%) Istio
10 1 (0.78%) logstash
10 1 (0.78%) Progress Chef
10 1 (0.78%) Puppet
10 1 (0.78%) RSA Archer
10 1 (0.78%) SCOM
Vendors
1 35 (27.34%) VMware
2 25 (19.53%) Microsoft
3 16 (12.50%) Red Hat
4 10 (7.81%) Citrix
5 8 (6.25%) Cisco
6 7 (5.47%) NetApp
7 5 (3.91%) Palo Alto
7 5 (3.91%) SolarWinds
8 4 (3.13%) EMC
8 4 (3.13%) Oracle
9 3 (2.34%) Arista
9 3 (2.34%) Atlassian
9 3 (2.34%) Veeam
10 2 (1.56%) FactSet
10 2 (1.56%) Fortinet
10 2 (1.56%) Meraki
10 2 (1.56%) Rapid7
10 2 (1.56%) Refinitiv
10 2 (1.56%) ServiceNow
10 2 (1.56%) Splunk