Computer Science Jobs in Central London

Computer Science
London > Central London

The table below provides summary statistics for permanent job vacancies advertised in Central London requiring Computer Science skills. It includes a benchmarking guide to the annual salaries offered in vacancies that cited Computer Science over the 6 months leading up to 30 April 2025, comparing them to the same period in the previous two years.

6 months to
30 Apr 2025
Same period 2024 Same period 2023
Rank 22 29 59
Rank change year-on-year +7 +30 0
Permanent jobs citing Computer Science 253 275 259
As % of all permanent jobs advertised in Central London 9.96% 7.27% 4.89%
As % of the Processes & Methodologies category 10.35% 7.85% 5.16%
Number of salaries quoted 150 219 236
10th Percentile £47,500 £41,315 £42,500
25th Percentile £56,250 £57,500 £54,688
Median annual salary (50th Percentile) £70,000 £80,000 £85,000
Median % change year-on-year -12.50% -5.88% +25.93%
75th Percentile £110,750 £100,000 £112,500
90th Percentile £120,000 £122,500 £137,500
London median annual salary £75,000 £77,500 £80,000
% change year-on-year -3.23% -3.13% +6.67%

All Process and Methodology Skills
Central London

Computer Science falls under the Processes and Methodologies category. For comparison with the information above, the following table provides summary statistics for all permanent job vacancies requiring process or methodology skills in Central London.

Permanent vacancies with a requirement for process or methodology skills 2,445 3,501 5,021
As % of all permanent jobs advertised in Central London 96.26% 92.55% 94.77%
Number of salaries quoted 1,668 2,741 4,162
10th Percentile £41,250 £40,000 £42,500
25th Percentile £55,000 £52,500 £55,000
Median annual salary (50th Percentile) £75,000 £72,500 £75,000
Median % change year-on-year +3.45% -3.33% +3.45%
75th Percentile £97,500 £95,000 £97,313
90th Percentile £120,000 £112,500 £112,500
London median annual salary £75,000 £70,555 £75,000
% change year-on-year +6.30% -5.93% +7.14%

Computer Science
Job Vacancy Trend in Central London

Job postings citing Computer Science as a proportion of all IT jobs advertised in Central London.
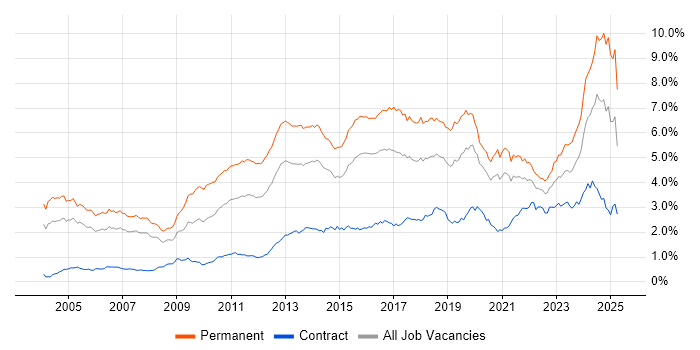
Job vacancy trend for Computer Science in Central London

Computer Science
Salary Trend in Central London

3-month moving average salary quoted in jobs citing Computer Science in Central London.

Salary trend for Computer Science in Central London

Computer Science
Salary Histogram in Central London

Salary distribution for jobs citing Computer Science in Central London over the 6 months to 30 April 2025.

Salary histogram for Computer Science in Central London

Computer Science
Job Locations in Central London

The table below looks at the demand and provides a guide to the median salaries quoted in IT jobs citing Computer Science within the Central London region over the 6 months to 30 April 2025. The 'Rank Change' column provides an indication of the change in demand within each location based on the same 6 month period last year.

Location Rank Change
on Same Period
Last Year
Matching
Permanent
IT Job Ads
Median Salary
Past 6 Months
Median Salary
% Change
on Same Period
Last Year
Live
Jobs
City of London +2 184 £70,000 -12.50% 54
City of Westminster +17 55 £62,500 - 6
Camden +8 22 £65,000 +62.50% 1
West End of London +2 5 £102,500 +95.24% 7
Southwark -7 1 - - 5
Computer Science
London

Computer Science
Co-occurring Skills and Capabilities in Central London by Category

The follow tables expand on the table above by listing co-occurrences grouped by category. The same employment type, locality and period is covered with up to 20 co-occurrences shown in each of the following categories:

Application Platforms
1 22 (8.70%) Apache Spark
2 6 (2.37%) SharePoint
3 3 (1.19%) Liferay
4 2 (0.79%) Confluence
5 1 (0.40%) Apache
5 1 (0.40%) Apache Airflow
5 1 (0.40%) Microsoft Exchange
5 1 (0.40%) nginx
Applications
1 10 (3.95%) Microsoft Excel
2 3 (1.19%) Microsoft Office
3 2 (0.79%) Microsoft Project
3 2 (0.79%) MS Visio
4 1 (0.40%) Blender
4 1 (0.40%) Chatbot
4 1 (0.40%) Maya
Business Applications
1 2 (0.79%) SAP Business One
2 1 (0.40%) Dynamics CRM
2 1 (0.40%) Dynamics GP
Cloud Services
1 59 (23.32%) Azure
2 57 (22.53%) AWS
3 33 (13.04%) GCP
4 24 (9.49%) SaaS
5 15 (5.93%) GitHub
6 14 (5.53%) Cloud Computing
7 12 (4.74%) GitHub Actions
7 12 (4.74%) Power Platform
8 9 (3.56%) Serverless
9 8 (3.16%) Microsoft Copilot
10 6 (2.37%) Azure AI
10 6 (2.37%) Azure Synapse Analytics
11 5 (1.98%) Azure Data Factory
11 5 (1.98%) Entra ID
12 4 (1.58%) Microsoft 365
12 4 (1.58%) PaaS
12 4 (1.58%) Snowflake
13 3 (1.19%) Amazon S3
13 3 (1.19%) AWS Lambda
14 2 (0.79%) Power Automate
Communications & Networking
1 31 (12.25%) HTTP
2 3 (1.19%) Firewall
2 3 (1.19%) Multicast
3 2 (0.79%) TCP/IP
3 2 (0.79%) Telnet
3 2 (0.79%) WAN
3 2 (0.79%) Wireless
4 1 (0.40%) Internet
4 1 (0.40%) Intrusion Detection
4 1 (0.40%) SAN
4 1 (0.40%) VLAN
4 1 (0.40%) VPN
Database & Business Intelligence
1 21 (8.30%) NoSQL
2 14 (5.53%) SQL Server
3 9 (3.56%) Power BI
4 8 (3.16%) MySQL
4 8 (3.16%) PostgreSQL
4 8 (3.16%) Relational Database
5 7 (2.77%) Tableau
6 6 (2.37%) MongoDB
7 5 (1.98%) Big Data
7 5 (1.98%) Data Warehouse
8 4 (1.58%) Amazon QuickSight
8 4 (1.58%) BigQuery
8 4 (1.58%) Crystal Reports
8 4 (1.58%) Data Lake
9 3 (1.19%) Amazon Redshift
9 3 (1.19%) Neo4j
9 3 (1.19%) SQL Server Integration Services
10 2 (0.79%) Data Mining
10 2 (0.79%) Power Query
11 1 (0.40%) Redis
Development Applications
1 24 (9.49%) Git
2 12 (4.74%) Gradle
3 10 (3.95%) JIRA
4 8 (3.16%) Jenkins
5 7 (2.77%) SonarQube
6 5 (1.98%) Maven
7 3 (1.19%) Visual Studio
8 2 (0.79%) Selenium
9 1 (0.40%) Babel
9 1 (0.40%) CircleCI
9 1 (0.40%) GitLab
9 1 (0.40%) gulp
9 1 (0.40%) JMeter
9 1 (0.40%) Moq
9 1 (0.40%) SpecFlow
9 1 (0.40%) webpack
General
1 138 (54.55%) Social Skills
2 70 (27.67%) Finance
3 43 (17.00%) Analytical Skills
4 39 (15.42%) Games
5 29 (11.46%) Inclusion and Diversity
5 29 (11.46%) Retail
6 27 (10.67%) Advertising
7 25 (9.88%) Law
8 19 (7.51%) Pharmaceutical
9 15 (5.93%) Banking
10 7 (2.77%) Front Office
11 4 (1.58%) Back Office
11 4 (1.58%) Electronics
11 4 (1.58%) Manufacturing
11 4 (1.58%) Presentation Skills
12 3 (1.19%) Financial Institution
12 3 (1.19%) Influencing Skills
12 3 (1.19%) Telecoms
13 2 (0.79%) Automotive
13 2 (0.79%) Legal
Job Titles
1 86 (33.99%) Senior
2 51 (20.16%) Developer
3 50 (19.76%) Software Engineer
4 43 (17.00%) Analyst
5 29 (11.46%) Senior Software Engineer
6 27 (10.67%) Architect
7 26 (10.28%) Lead
8 25 (9.88%) Solutions Architect
9 23 (9.09%) Senior Developer
10 22 (8.70%) Software Developer
11 17 (6.72%) Qualitative Analyst
11 17 (6.72%) Quantitative Analyst
11 17 (6.72%) Senior Software Developer
12 16 (6.32%) Data Engineer
13 15 (5.93%) Senior Architect
13 15 (5.93%) Senior Solutions Architect
14 10 (3.95%) ServiceNow Architect
15 9 (3.56%) Lead Data Engineer
15 9 (3.56%) Lead Software Engineer
15 9 (3.56%) Technical Manager
Libraries, Frameworks & Software Standards
1 33 (13.04%) Kafka
2 20 (7.91%) .NET
3 18 (7.11%) CSS
3 18 (7.11%) HTML
4 14 (5.53%) React
5 11 (4.35%) AngularJS
5 11 (4.35%) HTML5
6 10 (3.95%) JSON
6 10 (3.95%) RabbitMQ
6 10 (3.95%) RESTful
6 10 (3.95%) WPF
7 8 (3.16%) ARM Templates
8 7 (2.77%) Elastic Stack
8 7 (2.77%) Pandas
8 7 (2.77%) REST
8 7 (2.77%) Spring
8 7 (2.77%) Unity (Game Engine)
9 6 (2.37%) FIX Protocol
9 6 (2.37%) Node.js
10 5 (1.98%) OpenAPI
Miscellaneous
1 31 (12.25%) Distributed Systems
2 28 (11.07%) Algorithms
3 18 (7.11%) Cloud Native
3 18 (7.11%) Life Science
4 17 (6.72%) Legacy Systems
4 17 (6.72%) Mobile Games
5 16 (6.32%) Management Information System
6 12 (4.74%) Mobile App
7 10 (3.95%) Onboarding
8 9 (3.56%) Robotics
9 8 (3.16%) Greenfield Project
10 7 (2.77%) Derivative
10 7 (2.77%) Enterprise Software
11 6 (2.37%) Product Ownership
12 5 (1.98%) Fixed Income
12 5 (1.98%) Hedge funds
12 5 (1.98%) Linux Command Line
13 4 (1.58%) SCADA
14 3 (1.19%) Equities
14 3 (1.19%) Reference Data
Operating Systems
1 25 (9.88%) Windows
2 23 (9.09%) Linux
3 7 (2.77%) Android
3 7 (2.77%) Apple iOS
4 6 (2.37%) Unix
5 4 (1.58%) Windows Server
6 3 (1.19%) Red Hat Enterprise Linux
6 3 (1.19%) Robot Operating System
6 3 (1.19%) Ubuntu
7 2 (0.79%) Mac OS
7 2 (0.79%) Rocky
8 1 (0.40%) CentOS
8 1 (0.40%) Windows Vista
Processes & Methodologies
1 103 (40.71%) Software Engineering
2 72 (28.46%) Agile
3 67 (26.48%) Data Science
4 61 (24.11%) Analytics
5 60 (23.72%) Problem-Solving
6 51 (20.16%) Mathematics
7 47 (18.58%) Statistics
8 42 (16.60%) Machine Learning
9 37 (14.62%) Artificial Intelligence
10 32 (12.65%) Data Modelling
10 32 (12.65%) Roadmaps
11 31 (12.25%) Physics
12 30 (11.86%) Visualisation
13 29 (11.46%) Process Improvement
14 27 (10.67%) DevOps
15 26 (10.28%) Data Visualisation
16 25 (9.88%) Mentoring
16 25 (9.88%) Microservices
17 24 (9.49%) CI/CD
18 22 (8.70%) Performance Metrics
Programming Languages
1 113 (44.66%) Python
2 55 (21.74%) SQL
3 49 (19.37%) C#
3 49 (19.37%) Java
4 38 (15.02%) JavaScript
5 31 (12.25%) Scala
6 30 (11.86%) C++
7 15 (5.93%) TypeScript
8 13 (5.14%) PowerShell
9 9 (3.56%) Kotlin
10 7 (2.77%) Objective-C
10 7 (2.77%) R
10 7 (2.77%) Swift
11 5 (1.98%) Rust
12 4 (1.58%) Bash
12 4 (1.58%) C
13 3 (1.19%) F#
14 2 (0.79%) Data Analysis Expressions
15 1 (0.40%) Go
15 1 (0.40%) Groovy
Qualifications
1 242 (95.65%) Degree
2 123 (48.62%) Computer Science Degree
3 71 (28.06%) Master's Degree
4 37 (14.62%) PhD
5 21 (8.30%) Azure Certification
6 8 (3.16%) Microsoft Certification
7 6 (2.37%) AWS Certification
7 6 (2.37%) Numerate Degree
8 5 (1.98%) AWS Certified Solutions Architect
9 3 (1.19%) PMI Certification
10 2 (0.79%) ITIL Certification
10 2 (0.79%) PMP
10 2 (0.79%) Six Sigma Master Black Belt
11 1 (0.40%) CISA
11 1 (0.40%) CISM
11 1 (0.40%) CISSP
11 1 (0.40%) SC Cleared
11 1 (0.40%) Security Cleared
11 1 (0.40%) VCAP
11 1 (0.40%) VMware Certified Professional (VCP)
Quality Assurance & Compliance
1 22 (8.70%) QA
2 7 (2.77%) GDPR
3 6 (2.37%) California Consumer Privacy Act
3 6 (2.37%) SLA
4 4 (1.58%) Accessibility
4 4 (1.58%) Data Quality
5 2 (0.79%) PMO
5 2 (0.79%) Software Quality Assurance
6 1 (0.40%) Actionable Recommendations
6 1 (0.40%) CDISC
6 1 (0.40%) COBIT
6 1 (0.40%) ISO/IEC 27001
6 1 (0.40%) NIST
6 1 (0.40%) NIST 800
System Software
1 19 (7.51%) Docker
2 8 (3.16%) Active Directory
3 1 (0.40%) Virtual Machines
3 1 (0.40%) VMware Infrastructure
3 1 (0.40%) vSphere
Systems Management
1 17 (6.72%) Kubernetes
2 14 (5.53%) Terraform
3 6 (2.37%) Prometheus
4 5 (1.98%) Argo
5 3 (1.19%) Grafana
6 2 (0.79%) Ansible
6 2 (0.79%) Nagios
7 1 (0.40%) Microsoft Intune
7 1 (0.40%) Single Sign-On
Vendors
1 60 (23.72%) Microsoft
2 54 (21.34%) Google
3 22 (8.70%) Apple
4 16 (6.32%) ServiceNow
5 12 (4.74%) New Relic
6 8 (3.16%) Oracle
6 8 (3.16%) SAP
7 7 (2.77%) OpenAI
8 6 (2.37%) Workday
9 5 (1.98%) Databricks
10 3 (1.19%) Red Hat
11 2 (0.79%) Atlassian
11 2 (0.79%) Splunk
11 2 (0.79%) VMware
12 1 (0.40%) FactSet
12 1 (0.40%) ION Trading
12 1 (0.40%) Refinitiv
12 1 (0.40%) Salesforce
12 1 (0.40%) SolarWinds
12 1 (0.40%) StreamSets