Banking Jobs in Central London

Banking
London > Central London

The table below looks at the prevalence of the term Banking in permanent job vacancies in Central London. Included is a benchmarking guide to the salaries offered in vacancies that cited Banking over the 6 months leading up to 30 April 2025, comparing them to the same period in the previous two years.

6 months to
30 Apr 2025
Same period 2024 Same period 2023
Rank 46 45 35
Rank change year-on-year -1 -10 +4
Permanent jobs citing Banking 135 201 386
As % of all permanent jobs advertised in Central London 5.31% 5.31% 7.29%
As % of the General category 7.42% 8.55% 11.12%
Number of salaries quoted 109 184 330
10th Percentile £46,000 £52,500 £50,000
25th Percentile £65,000 £66,250 £65,313
Median annual salary (50th Percentile) £85,000 £82,500 £87,500
Median % change year-on-year +3.03% -5.71% +4.48%
75th Percentile £115,000 £105,375 £110,000
90th Percentile £130,500 £140,000 £126,250
London median annual salary £95,000 £90,000 £85,000
% change year-on-year +5.56% +5.88% +6.25%

All General Skills
Central London

Banking falls under the General Skills category. For comparison with the information above, the following table provides summary statistics for all permanent job vacancies requiring common skills in Central London.

Permanent vacancies with a requirement for common skills 1,820 2,352 3,471
As % of all permanent jobs advertised in Central London 71.65% 62.17% 65.52%
Number of salaries quoted 1,167 1,821 2,807
10th Percentile £41,250 £38,397 £41,250
25th Percentile £52,500 £50,000 £53,750
Median annual salary (50th Percentile) £70,000 £70,000 £72,500
Median % change year-on-year - -3.45% +3.57%
75th Percentile £96,250 £90,000 £95,000
90th Percentile £120,000 £110,000 £115,000
London median annual salary £75,000 £70,000 £74,000
% change year-on-year +7.14% -5.41% +5.71%

Banking
Job Vacancy Trend in Central London

Job postings citing Banking as a proportion of all IT jobs advertised in Central London.
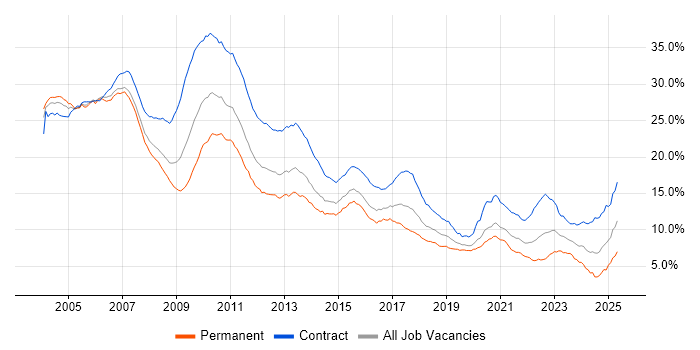
Job vacancy trend for Banking in Central London

Banking
Salary Trend in Central London

3-month moving average salary quoted in jobs citing Banking in Central London.

Salary trend for Banking in Central London

Banking
Salary Histogram in Central London

Salary distribution for jobs citing Banking in Central London over the 6 months to 30 April 2025.

Salary histogram for Banking in Central London

Banking
Job Locations in Central London

The table below looks at the demand and provides a guide to the median salaries quoted in IT jobs citing Banking within the Central London region over the 6 months to 30 April 2025. The 'Rank Change' column provides an indication of the change in demand within each location based on the same 6 month period last year.

Location Rank Change
on Same Period
Last Year
Matching
Permanent
IT Job Ads
Median Salary
Past 6 Months
Median Salary
% Change
on Same Period
Last Year
Live
Jobs
City of London -2 119 £81,250 -1.52% 65
West End of London -3 4 £102,500 +45.23% 5
Camden - 4 - -
Southwark - 1 £90,000 -
Banking
London

Banking
Co-occurring Skills and Capabilities in Central London by Category

The follow tables expand on the table above by listing co-occurrences grouped by category. The same employment type, locality and period is covered with up to 20 co-occurrences shown in each of the following categories:

Application Platforms
1 6 (4.44%) SharePoint
2 4 (2.96%) WordPress
3 3 (2.22%) Microsoft Exchange
4 2 (1.48%) nginx
4 2 (1.48%) Tomcat
5 1 (0.74%) SAS
Applications
1 9 (6.67%) Microsoft Office
2 5 (3.70%) Microsoft Excel
3 2 (1.48%) Microsoft PowerPoint
4 1 (0.74%) Chatbot
Business Applications
1 6 (4.44%) Orchestrade
2 3 (2.22%) SimCorp Dimension
3 2 (1.48%) Dynamics CRM
3 2 (1.48%) Fidessa
4 1 (0.74%) Payment Gateway
Cloud Services
1 29 (21.48%) AWS
2 20 (14.81%) Azure
3 9 (6.67%) Power Platform
4 8 (5.93%) Amazon ECS
4 8 (5.93%) GCP
4 8 (5.93%) Serverless
5 6 (4.44%) Microsoft 365
6 5 (3.70%) Amazon S3
6 5 (3.70%) AWS Step Functions
6 5 (3.70%) GitHub
7 4 (2.96%) Amazon EKS
7 4 (2.96%) AWS Lambda
7 4 (2.96%) Cloud Computing
7 4 (2.96%) Google Analytics
8 3 (2.22%) Amazon Kinesis
8 3 (2.22%) Copilot Studio
8 3 (2.22%) Microsoft Copilot
8 3 (2.22%) Microsoft Purview
9 2 (1.48%) Amazon ECR
9 2 (1.48%) Azure App Service
Communications & Networking
1 5 (3.70%) Firewall
1 5 (3.70%) Multicast
2 4 (2.96%) Internet
3 3 (2.22%) Network Security
4 2 (1.48%) DNS
4 2 (1.48%) NetScaler
4 2 (1.48%) Telnet
4 2 (1.48%) VLAN
4 2 (1.48%) VPN
5 1 (0.74%) SAN
5 1 (0.74%) VSAN
Database & Business Intelligence
1 11 (8.15%) Relational Database
2 9 (6.67%) SQL Server
3 7 (5.19%) Power BI
4 6 (4.44%) MySQL
5 5 (3.70%) PostgreSQL
5 5 (3.70%) RDBMS
6 4 (2.96%) Redis
6 4 (2.96%) Tableau
7 3 (2.22%) Data Warehouse
8 2 (1.48%) ClickHouse
8 2 (1.48%) Crystal Reports
8 2 (1.48%) DynamoDB
8 2 (1.48%) Elasticsearch
8 2 (1.48%) Oracle Database
8 2 (1.48%) Semantic Layer
9 1 (0.74%) Amazon Aurora
9 1 (0.74%) Amazon RDS
9 1 (0.74%) Data Lake
9 1 (0.74%) Qlik Sense
9 1 (0.74%) Tableau Desktop
Development Applications
1 17 (12.59%) Git
2 11 (8.15%) JIRA
3 5 (3.70%) Atlassian Bamboo
4 4 (2.96%) Jenkins
4 4 (2.96%) JUnit
4 4 (2.96%) Selenium
5 3 (2.22%) Cypress.io
5 3 (2.22%) GitLab
5 3 (2.22%) Postman
6 2 (1.48%) Artifactory
6 2 (1.48%) Maven
6 2 (1.48%) Mockito
6 2 (1.48%) Octopus Deploy
6 2 (1.48%) REST Assured
6 2 (1.48%) SoapUI
6 2 (1.48%) SonarQube
6 2 (1.48%) Subversion
6 2 (1.48%) Visual Studio
6 2 (1.48%) Xcode
6 2 (1.48%) XCTest
General
1 89 (65.93%) Finance
2 47 (34.81%) Social Skills
3 39 (28.89%) Investment Banking
4 20 (14.81%) Front Office
5 15 (11.11%) Analytical Skills
6 10 (7.41%) Inclusion and Diversity
7 9 (6.67%) Financial Institution
8 7 (5.19%) Retail
9 6 (4.44%) Organisational Skills
10 3 (2.22%) Back Office
10 3 (2.22%) French Language
10 3 (2.22%) Law
10 3 (2.22%) Marketing
11 2 (1.48%) Advertising
11 2 (1.48%) Legal
11 2 (1.48%) Presentation Skills
11 2 (1.48%) Wholesale Banking
12 1 (0.74%) Documentation Skills
12 1 (0.74%) Publishing
12 1 (0.74%) Telecoms
Job Titles
1 40 (29.63%) Developer
2 27 (20.00%) Senior
3 18 (13.33%) Analyst
4 16 (11.85%) Senior Developer
5 15 (11.11%) Software Engineer
6 12 (8.89%) Support Analyst
7 11 (8.15%) C# Developer
7 11 (8.15%) Lead
8 10 (7.41%) Banking Analyst
9 9 (6.67%) Applications Support
9 9 (6.67%) Software Developer
10 8 (5.93%) .NET Developer
10 8 (5.93%) Applications Support Analyst
10 8 (5.93%) AWS Developer
10 8 (5.93%) Python Developer
11 6 (4.44%) Infrastructure Engineer
11 6 (4.44%) Java Developer
11 6 (4.44%) Java Engineer
11 6 (4.44%) React Developer
12 5 (3.70%) C++ Developer
Libraries, Frameworks & Software Standards
1 17 (12.59%) FIX Protocol
2 13 (9.63%) .NET
3 10 (7.41%) Node.js
3 10 (7.41%) Web Services
4 8 (5.93%) Middleware
4 8 (5.93%) REST
5 7 (5.19%) Flask
6 6 (4.44%) Django
6 6 (4.44%) Kafka
6 6 (4.44%) React
7 5 (3.70%) GraphQL
8 4 (2.96%) AWS CDK
8 4 (2.96%) Spring
9 3 (2.22%) .NET Core
9 3 (2.22%) .NET Framework
9 3 (2.22%) Boost C++ Libraries
9 3 (2.22%) pytest
9 3 (2.22%) Spring Boot
9 3 (2.22%) Swagger
10 2 (1.48%) HTML5
Miscellaneous
1 14 (10.37%) Foreign Exchange (FX)
2 11 (8.15%) Fixed Income
3 10 (7.41%) Greenfield Project
4 9 (6.67%) Cloud Native
4 9 (6.67%) Self-Motivation
5 8 (5.93%) Derivative
6 6 (4.44%) Equities
7 4 (2.96%) Legacy Systems
7 4 (2.96%) Social Media
7 4 (2.96%) Video Conferencing
8 3 (2.22%) Algorithms
8 3 (2.22%) Distributed Systems
8 3 (2.22%) Hedge funds
8 3 (2.22%) Onboarding
8 3 (2.22%) Product Ownership
8 3 (2.22%) Reference Data
9 2 (1.48%) Hybrid Cloud
10 1 (0.74%) Blockchain
10 1 (0.74%) Cyber Threat
10 1 (0.74%) Public Cloud
Operating Systems
1 31 (22.96%) Linux
2 15 (11.11%) Unix
2 15 (11.11%) Windows
3 7 (5.19%) Red Hat Enterprise Linux
4 5 (3.70%) CentOS
5 4 (2.96%) Rocky
5 4 (2.96%) Windows Server
6 2 (1.48%) Ubuntu
6 2 (1.48%) Windows Server 2016
Processes & Methodologies
1 43 (31.85%) Agile
2 35 (25.93%) Problem-Solving
3 27 (20.00%) DevOps
4 22 (16.30%) CI/CD
5 20 (14.81%) Software Engineering
6 17 (12.59%) Fintech
6 17 (12.59%) Microservices
7 16 (11.85%) Analytics
8 15 (11.11%) Computer Science
8 15 (11.11%) Investment Management
9 14 (10.37%) Infrastructure as Code
9 14 (10.37%) Mentoring
9 14 (10.37%) Stakeholder Management
10 13 (9.63%) Data Science
10 13 (9.63%) Risk Management
11 11 (8.15%) Low Latency
11 11 (8.15%) TDD
12 10 (7.41%) Artificial Intelligence
12 10 (7.41%) Project Management
13 9 (6.67%) Full-Stack Development
Programming Languages
1 50 (37.04%) Python
2 41 (30.37%) SQL
3 34 (25.19%) Java
4 23 (17.04%) C#
5 19 (14.07%) Bash
6 14 (10.37%) C++
6 14 (10.37%) JavaScript
7 11 (8.15%) TypeScript
8 10 (7.41%) PowerShell
9 8 (5.93%) Rust
10 4 (2.96%) T-SQL
11 3 (2.22%) Go
12 2 (1.48%) Groovy
12 2 (1.48%) PL/SQL
12 2 (1.48%) Ruby
12 2 (1.48%) Search Processing Language
12 2 (1.48%) Shell Script
12 2 (1.48%) VBA
13 1 (0.74%) Perl
13 1 (0.74%) Scala
Qualifications
1 21 (15.56%) Degree
2 4 (2.96%) AWS Certification
2 4 (2.96%) Computer Science Degree
3 3 (2.22%) Azure Certification
3 3 (2.22%) Microsoft Certification
3 3 (2.22%) RHCSA
4 2 (1.48%) ISTQB
Quality Assurance & Compliance
1 12 (8.89%) QA
2 3 (2.22%) Data Quality
2 3 (2.22%) GDPR
3 1 (0.74%) Actionable Recommendations
3 1 (0.74%) MiFID
3 1 (0.74%) PCI DSS
3 1 (0.74%) PSD2
3 1 (0.74%) SLA
System Software
1 15 (11.11%) Docker
2 10 (7.41%) VMware Infrastructure
3 8 (5.93%) VMware ESXi
4 6 (4.44%) Hyper-V
5 4 (2.96%) Virtual Desktop
6 2 (1.48%) Active Directory
6 2 (1.48%) Firmware
7 1 (0.74%) Virtual Servers
7 1 (0.74%) vSphere
Systems Management
1 15 (11.11%) Ansible
1 15 (11.11%) Kubernetes
2 8 (5.93%) Grafana
2 8 (5.93%) Terraform
3 7 (5.19%) Nagios
4 5 (3.70%) Single Sign-On
5 3 (2.22%) SCCM
6 2 (1.48%) Microsoft Intune
6 2 (1.48%) Progress Chef
6 2 (1.48%) Prometheus
6 2 (1.48%) Red Hat Satellite
6 2 (1.48%) vCenter Server
7 1 (0.74%) SCOM
Vendors
1 24 (17.78%) Microsoft
2 12 (8.89%) VMware
3 9 (6.67%) Red Hat
4 8 (5.93%) Oracle
5 6 (4.44%) SolarWinds
5 6 (4.44%) Splunk
6 5 (3.70%) Cisco
6 5 (3.70%) Google
7 3 (2.22%) Alteryx
7 3 (2.22%) Arista
7 3 (2.22%) Barracuda Networks
7 3 (2.22%) Databricks
7 3 (2.22%) Palo Alto
7 3 (2.22%) Salesforce
7 3 (2.22%) SimCorp
8 2 (1.48%) CA Agile Central
8 2 (1.48%) FactSet
8 2 (1.48%) Rapid7
8 2 (1.48%) Refinitiv
8 2 (1.48%) ServiceNow