C# Jobs in Central London

C#
London > Central London

The table below provides summary statistics for permanent job vacancies advertised in Central London requiring C# skills. It includes a benchmarking guide to the annual salaries offered in vacancies that cited C# over the 6 months leading up to 12 July 2025, comparing them to the same period in the previous two years.

6 months to
12 Jul 2025
Same period 2024 Same period 2023
Rank 33 21 17
Rank change year-on-year -12 -4 +1
Permanent jobs citing C# 181 317 551
As % of all permanent jobs advertised in Central London 7.79% 8.60% 11.22%
As % of the Programming Languages category 17.50% 19.79% 22.57%
Number of salaries quoted 162 261 490
10th Percentile £57,500 £42,500 £50,000
25th Percentile £70,000 £55,000 £57,500
Median annual salary (50th Percentile) £85,500 £75,000 £72,500
Median % change year-on-year +14.00% +3.45% -
75th Percentile £115,000 £100,000 £97,500
90th Percentile £126,250 £122,500 £115,000
London median annual salary £80,000 £75,000 £77,500
% change year-on-year +6.67% -3.23% +6.90%

All Programming Languages
Central London

C# falls under the Programming Languages category. For comparison with the information above, the following table provides summary statistics for all permanent job vacancies requiring coding skills in Central London.

Permanent vacancies with a requirement for coding skills 1,034 1,602 2,441
As % of all permanent jobs advertised in Central London 44.49% 43.49% 49.71%
Number of salaries quoted 832 1,240 2,189
10th Percentile £52,500 £46,250 £49,600
25th Percentile £62,500 £57,500 £60,000
Median annual salary (50th Percentile) £82,500 £75,000 £77,500
Median % change year-on-year +10.00% -3.23% +3.33%
75th Percentile £110,000 £97,500 £102,500
90th Percentile £127,500 £115,000 £117,500
London median annual salary £82,500 £80,000 £80,000
% change year-on-year +3.13% - +6.67%

C#
Job Vacancy Trend in Central London

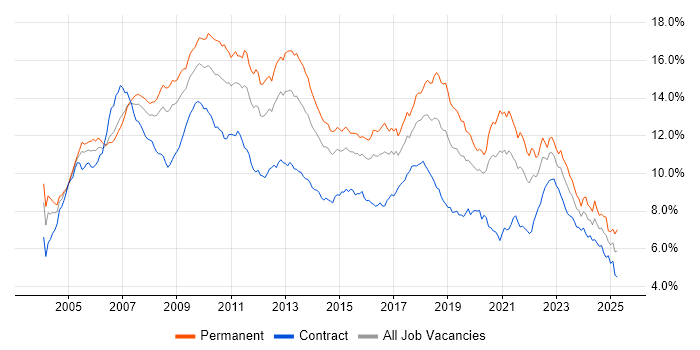
Job postings citing C# as a proportion of all IT jobs advertised in Central London.

Job vacancy trend for C# in Central London

C#
Salary Trend in Central London

3-month moving average salary quoted in jobs citing C# in Central London.

Salary trend for C# in Central London

C#
Salary Histogram in Central London

Salary distribution for jobs citing C# in Central London over the 6 months to 12 July 2025.

Salary histogram for C# in Central London

C#
Job Locations in Central London

The table below looks at the demand and provides a guide to the median salaries quoted in IT jobs citing C# within the Central London region over the 6 months to 12 July 2025. The 'Rank Change' column provides an indication of the change in demand within each location based on the same 6 month period last year.

Location Rank Change
on Same Period
Last Year
Matching
Permanent
IT Job Ads
Median Salary
Past 6 Months
Median Salary
% Change
on Same Period
Last Year
Live
Jobs
City of London -8 162 £85,000 +11.84% 94
West End of London +8 4 £102,500 +57.69% 2
City of Westminster +1 4 £82,128 -1.94% 2
Camden -10 4 - -
Southwark -10 1 £65,000 -
Lambeth - 1 £80,000 -
Kensington and Chelsea - 1 £92,500 - 1
C#
London

C#
Co-occurring Skills and Capabilities in Central London by Category

The follow tables expand on the table above by listing co-occurrences grouped by category. The same employment type, locality and period is covered with up to 20 co-occurrences shown in each of the following categories:

Application Platforms
1 16 (8.84%) SharePoint
2 6 (3.31%) Microsoft Exchange
3 5 (2.76%) IIS
4 4 (2.21%) CMS
5 1 (0.55%) Confluence
5 1 (0.55%) NServiceBus
Applications
1 1 (0.55%) Microsoft Excel
1 1 (0.55%) Microsoft Office
1 1 (0.55%) Microsoft PowerPoint
1 1 (0.55%) MS Visio
Business Applications
1 14 (7.73%) Dynamics CRM
2 6 (3.31%) Orchestrade
3 4 (2.21%) Elite 3E
4 1 (0.55%) Eikon
4 1 (0.55%) Endur
4 1 (0.55%) RMDS
Cloud Services
1 87 (48.07%) Azure
2 30 (16.57%) Power Platform
3 25 (13.81%) Azure DevOps
4 24 (13.26%) Microsoft 365
5 23 (12.71%) PowerApps
6 16 (8.84%) AWS
7 14 (7.73%) Datadog
7 14 (7.73%) Dynamics 365
7 14 (7.73%) Power Automate
7 14 (7.73%) SaaS
8 13 (7.18%) Azure Data Factory
9 11 (6.08%) GitHub
10 10 (5.52%) IaaS
11 9 (4.97%) Azure Logic Apps
11 9 (4.97%) Azure Service Bus
11 9 (4.97%) PaaS
12 8 (4.42%) GCP
13 6 (3.31%) Serverless
14 5 (2.76%) Azure Functions
14 5 (2.76%) ShareGate
Database & Business Intelligence
1 42 (23.20%) SQL Server
2 21 (11.60%) Relational Database
3 16 (8.84%) Power BI
4 12 (6.63%) SQL Server Reporting Services
5 8 (4.42%) NoSQL
5 8 (4.42%) SQL Server Integration Services
6 7 (3.87%) PostgreSQL
7 6 (3.31%) DB2
8 5 (2.76%) RDBMS
9 4 (2.21%) Data Hub
9 4 (2.21%) MongoDB
9 4 (2.21%) MySQL
9 4 (2.21%) SQL CLR
9 4 (2.21%) Tableau
10 3 (1.66%) Azure SQL Database
10 3 (1.66%) DynamoDB
11 2 (1.10%) Amazon Athena
11 2 (1.10%) Big Data
11 2 (1.10%) Crystal Reports
11 2 (1.10%) Redis
Development Applications
1 14 (7.73%) JIRA
2 11 (6.08%) Git
3 5 (2.76%) Visual Studio
4 3 (1.66%) Artifactory
4 3 (1.66%) MSTest
4 3 (1.66%) NUnit
4 3 (1.66%) Octopus Deploy
4 3 (1.66%) SpecFlow
5 2 (1.10%) Jenkins
5 2 (1.10%) Selenium
5 2 (1.10%) Team Foundation Server
5 2 (1.10%) TeamCity
6 1 (0.55%) Atlassian Bamboo
6 1 (0.55%) Bitbucket
6 1 (0.55%) Crucible
6 1 (0.55%) JetBrains Rider
6 1 (0.55%) Moq
6 1 (0.55%) NeoLoad
6 1 (0.55%) SoapUI
6 1 (0.55%) Vagrant
General
1 76 (41.99%) Social Skills
2 69 (38.12%) Finance
3 22 (12.15%) Banking
4 19 (10.50%) Analytical Skills
5 12 (6.63%) Marketing
6 11 (6.08%) Inclusion and Diversity
7 9 (4.97%) Front Office
7 9 (4.97%) Investment Banking
8 8 (4.42%) Billing
8 8 (4.42%) Legal
9 7 (3.87%) Back Office
10 5 (2.76%) Law
11 4 (2.21%) Public Sector
12 3 (1.66%) French Language
12 3 (1.66%) Games
13 2 (1.10%) Financial Institution
14 1 (0.55%) Advertising
14 1 (0.55%) Health Technology
14 1 (0.55%) Pharmaceutical
14 1 (0.55%) Retail
Job Titles
1 87 (48.07%) Developer
2 45 (24.86%) Senior
3 22 (12.15%) C# Developer
4 20 (11.05%) .NET Developer
4 20 (11.05%) Analyst
4 20 (11.05%) Lead
5 19 (10.50%) Software Engineer
6 15 (8.29%) Senior Developer
7 12 (6.63%) Architect
7 12 (6.63%) Qualitative Analyst
7 12 (6.63%) Quantitative Analyst
7 12 (6.63%) Software Developer
7 12 (6.63%) Solutions Architect
8 11 (6.08%) Full-Stack Developer
9 10 (5.52%) Lead Developer
9 10 (5.52%) Senior Analyst
10 8 (4.42%) Dynamics 365 Specialist
10 8 (4.42%) Power Platform Specialist
10 8 (4.42%) Senior Architect
10 8 (4.42%) Senior Solutions Architect
Libraries, Frameworks & Software Standards
1 101 (55.80%) .NET
2 26 (14.36%) React
2 26 (14.36%) RESTful
3 24 (13.26%) .NET Core
4 21 (11.60%) HTML
5 19 (10.50%) .NET Framework
5 19 (10.50%) AngularJS
5 19 (10.50%) CSS
6 12 (6.63%) FIX Protocol
6 12 (6.63%) Web Services
7 10 (5.52%) Entity Framework
7 10 (5.52%) HTML5
7 10 (5.52%) XML
8 8 (4.42%) ASP.NET
8 8 (4.42%) REST
9 7 (3.87%) Kafka
9 7 (3.87%) Middleware
9 7 (3.87%) RabbitMQ
10 5 (2.76%) ASP.NET Web API
10 5 (2.76%) Node.js
Miscellaneous
1 19 (10.50%) Onboarding
2 14 (7.73%) Greenfield Project
3 12 (6.63%) Foreign Exchange (FX)
4 11 (6.08%) Data Structures
5 10 (5.52%) Analytical Mindset
5 10 (5.52%) Product Ownership
6 6 (3.31%) Legacy Applications
7 5 (2.76%) Cloud Native
7 5 (2.76%) Enterprise Software
7 5 (2.76%) Fixed Income
8 4 (2.21%) Derivative
8 4 (2.21%) Private Cloud
8 4 (2.21%) Team-Oriented Environment
9 3 (1.66%) Algorithms
9 3 (1.66%) Legacy Systems
9 3 (1.66%) Low-Code
10 2 (1.10%) Equities
10 2 (1.10%) Hedge funds
10 2 (1.10%) Self-Motivation
10 2 (1.10%) Sports Betting
Operating Systems
1 15 (8.29%) Windows
2 4 (2.21%) Windows Server
3 1 (0.55%) Android
3 1 (0.55%) Apple iOS
Processes & Methodologies
1 74 (40.88%) Agile
2 66 (36.46%) DevOps
3 50 (27.62%) CI/CD
4 42 (23.20%) Problem-Solving
5 34 (18.78%) Software Engineering
6 32 (17.68%) Computer Science
7 31 (17.13%) Migration
8 28 (15.47%) Microservices
9 23 (12.71%) Mathematics
10 22 (12.15%) Collaborative Working
10 22 (12.15%) Mentoring
10 22 (12.15%) Test Automation
11 21 (11.60%) Scrum
12 20 (11.05%) Continuous Improvement
12 20 (11.05%) Full-Stack Development
13 19 (10.50%) Data Science
13 19 (10.50%) User Experience
14 16 (8.84%) Physics
15 15 (8.29%) Business Intelligence
15 15 (8.29%) Fintech
Programming Languages
1 84 (46.41%) SQL
2 57 (31.49%) Java
3 52 (28.73%) Python
4 45 (24.86%) JavaScript
5 23 (12.71%) TypeScript
6 19 (10.50%) C++
7 9 (4.97%) PL/SQL
7 9 (4.97%) VB.NET
8 6 (3.31%) PowerShell
9 4 (2.21%) Go
9 4 (2.21%) MATLAB
9 4 (2.21%) Rust
10 3 (1.66%) F#
11 2 (1.10%) Bash
11 2 (1.10%) C
12 1 (0.55%) Kotlin
12 1 (0.55%) PHP
12 1 (0.55%) T-SQL
12 1 (0.55%) VB
12 1 (0.55%) X++
Qualifications
1 48 (26.52%) Degree
2 16 (8.84%) Master's Degree
3 14 (7.73%) Microsoft Certification
4 8 (4.42%) Computer Science Degree
5 6 (3.31%) PhD
6 5 (2.76%) Security Cleared
7 3 (1.66%) Numerate Degree
7 3 (1.66%) TOGAF Certification
8 1 (0.55%) DV Cleared
8 1 (0.55%) ISTQB
8 1 (0.55%) SC Cleared
Quality Assurance & Compliance
1 13 (7.18%) QA
2 2 (1.10%) Accessibility
2 2 (1.10%) EMIR
2 2 (1.10%) MiFID
3 1 (0.55%) CDISC
3 1 (0.55%) ITGC
System Software
1 15 (8.29%) Docker
2 4 (2.21%) VMware Infrastructure
3 1 (0.55%) Active Directory
Systems Management
1 22 (12.15%) Kubernetes
2 5 (2.76%) Terraform
3 2 (1.10%) Ansible
3 2 (1.10%) Progress Chef
3 2 (1.10%) Puppet
4 1 (0.55%) Consul
4 1 (0.55%) Microsoft Intune
4 1 (0.55%) Packer
4 1 (0.55%) Prometheus
4 1 (0.55%) Salt
Vendors
1 56 (30.94%) Microsoft
2 20 (11.05%) Guidewire
3 11 (6.08%) Oracle
4 5 (2.76%) Aderant
5 4 (2.21%) Intapp
5 4 (2.21%) Okta
5 4 (2.21%) VMware
5 4 (2.21%) Zscaler
6 3 (1.66%) Barracuda Networks
6 3 (1.66%) ServiceNow
7 2 (1.10%) iManage
7 2 (1.10%) Murex
8 1 (0.55%) Bloomberg
8 1 (0.55%) Google
8 1 (0.55%) Informatica
8 1 (0.55%) MuleSoft
8 1 (0.55%) OpenLink
8 1 (0.55%) Reuters
8 1 (0.55%) Trayport