Business Development Job Trends in Central London

Business Development
London > Central London

The table below provides summary statistics and salary benchmarking for jobs advertised in Central London requiring Business Development skills. It covers permanent job vacancies from the 6 months leading up to 14 October 2026, with comparisons to the same periods in the previous two years.

6 months to
14 Oct 2026
Same period 2025 Same period 2024
Rank 19 75 135
Rank change year-on-year +56 +60 -38
Permanent jobs citing Business Development 208 67 50
As % of all permanent jobs in Central London 7.57% 3.52% 1.56%
As % of the Processes & Methodologies category 9.13% 3.67% 1.66%
Number of salaries quoted 170 42 17
10th Percentile £40,000 - £42,000
25th Percentile £51,625 £49,200 £46,250
Median annual salary (50th Percentile) £65,000 £68,750 £75,000
Median % change year-on-year -5.45% -8.33% +91.89%
75th Percentile £100,000 £115,000 £101,250
90th Percentile - £121,750 £101,750
London median annual salary £60,000 £61,250 £70,000
% change year-on-year -2.04% -12.50% +19.66%

All Process & Methodology Skills
Central London

Business Development falls under the Processes and Methodologies category. For comparison with the information above, the following table provides summary statistics for all permanent job vacancies requiring process or methodology skills in Central London.

Permanent vacancies with a requirement for process or methodology skills 2,278 1,826 3,013
As % of all permanent jobs advertised in Central London 82.90% 95.90% 93.75%
Number of salaries quoted 1,629 1,464 1,948
10th Percentile £45,000 £40,000 £45,000
25th Percentile £60,000 £55,000 £55,000
Median annual salary (50th Percentile) £80,000 £75,000 £75,000
Median % change year-on-year +6.67% - +3.45%
75th Percentile £100,000 £95,000 £95,000
90th Percentile £107,500 £120,000 £115,000
London median annual salary £75,000 £75,000 £75,000

Business Development
Job Vacancy Trend in Central London

Historical trend showing the proportion of permanent IT job postings citing Business Development relative to all permanent IT jobs advertised in Central London.

Business Development job vacancy trend in Central London

Business Development
Salary Trend in Central London

Salary distribution trend for jobs in Central London citing Business Development.
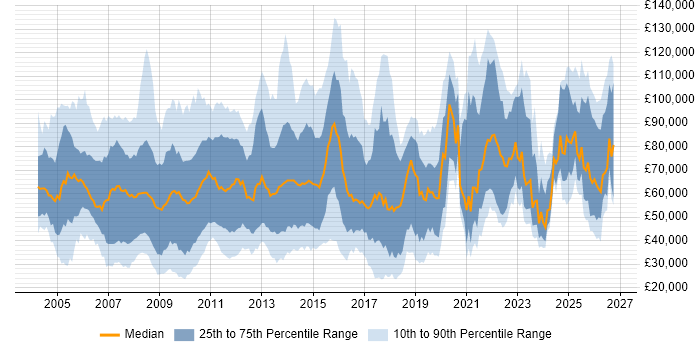
Salary distribution trend for jobs in Central London citing Business Development

Business Development
Salary Histogram in Central London

Salary distribution for jobs citing Business Development in Central London over the 6 months to 14 October 2026.

Salary histogram for Business Development in Central London

Business Development
Job Locations in Central London

The table below looks at the demand and provides a guide to the median salaries quoted in IT jobs citing Business Development within the Central London region over the 6 months to 14 October 2026. The 'Rank Change' column provides an indication of the change in demand within each location based on the same 6 month period last year.

Location Rank Change
on Same Period
Last Year
Matching
Permanent
IT Job Ads
Median Salary
Past 6 Months
Median Salary
% Change
on Same Period
Last Year
Live
Jobs
City of London +63 194 £65,000 +13.04% 109
Southwark -13 6 - - 1
Camden +4 5 £65,000 +13.04%
West End of London +1 3 - - 1
Business Development
London

Business Development
Co-Occurring Skills & Capabilities in Central London by Category

The following tables expand on the one above by listing co-occurrences grouped by category. They cover the same employment type, locality and period, with up to 20 co-occurrences shown in each category:

Application Platforms
1 1 (0.48%) SharePoint
Applications
1 3 (1.44%) Microsoft Office
Business Applications
1 4 (1.92%) Dynamics CRM
2 1 (0.48%) SAP HCM
2 1 (0.48%) SAP S/4HANA
Cloud Services
1 15 (7.21%) Azure
2 8 (3.85%) SaaS
3 7 (3.37%) Power Platform
4 6 (2.88%) Azure AI
4 6 (2.88%) Copilot Studio
4 6 (2.88%) GCP
4 6 (2.88%) Microsoft Copilot
4 6 (2.88%) Snowflake
5 5 (2.40%) AWS
6 3 (1.44%) Dynamics 365
6 3 (1.44%) Microsoft 365
6 3 (1.44%) Microsoft Purview
6 3 (1.44%) PaaS
6 3 (1.44%) Serverless
7 2 (0.96%) Azure Sentinel
7 2 (0.96%) Entra ID
8 1 (0.48%) AWS CloudFormation
8 1 (0.48%) Azure Data Factory
8 1 (0.48%) GitHub
8 1 (0.48%) SuccessFactors
Communications & Networking
1 1 (0.48%) Unified Communications
Database & Business Intelligence
1 2 (0.96%) PostgreSQL
2 1 (0.48%) BigQuery
2 1 (0.48%) GIS
2 1 (0.48%) MongoDB
2 1 (0.48%) Power BI
2 1 (0.48%) SQL Server
Development Applications
1 1 (0.48%) Cypress.io
General
1 31 (14.90%) Social Skills
2 29 (13.94%) Finance
3 16 (7.69%) Retail
4 12 (5.77%) Presentation Skills
5 10 (4.81%) Legal
5 10 (4.81%) Public Sector
6 9 (4.33%) Analytical Skills
6 9 (4.33%) Marketing
7 7 (3.37%) Inclusion and Diversity
7 7 (3.37%) Law
7 7 (3.37%) Pharmaceutical
8 6 (2.88%) Banking
8 6 (2.88%) Local Government
9 5 (2.40%) Social Housing
10 4 (1.92%) Brand Awareness
10 4 (1.92%) Influencing Skills
11 2 (0.96%) Advertising
11 2 (0.96%) Back Office
11 2 (0.96%) Documentation Skills
11 2 (0.96%) Telecoms
Job Titles
1 147 (70.67%) Development Manager
2 140 (67.31%) Business Development Manager
3 139 (66.83%) Business Manager
4 21 (10.10%) Senior
5 19 (9.13%) Senior Manager
6 14 (6.73%) Business Development Director
6 14 (6.73%) Development Director
7 12 (5.77%) Sales Manager
8 11 (5.29%) Senior Business Development Manager
8 11 (5.29%) Senior Business Manager
8 11 (5.29%) Senior Development Manager
9 10 (4.81%) Consultant
10 9 (4.33%) IT Development Manager
10 9 (4.33%) IT Manager
10 9 (4.33%) Sales Business Development Manager
11 8 (3.85%) Lead
12 7 (3.37%) Business Development Executive
13 6 (2.88%) Data Centre Manager
13 6 (2.88%) Research Manager
14 4 (1.92%) Finance Manager
Libraries, Frameworks & Software Standards
1 3 (1.44%) Flash
2 2 (0.96%) EDI
2 2 (0.96%) FastAPI
2 2 (0.96%) Oracle Fusion
2 2 (0.96%) pydantic
2 2 (0.96%) React
3 1 (0.48%) Celery
3 1 (0.48%) CrewAI
3 1 (0.48%) Flask
3 1 (0.48%) Hugging Face
3 1 (0.48%) Jest
3 1 (0.48%) LangChain
3 1 (0.48%) LangGraph
3 1 (0.48%) Model Context Protocol
3 1 (0.48%) Plotly
3 1 (0.48%) Redux
3 1 (0.48%) SQLAlchemy
3 1 (0.48%) Streamlit
3 1 (0.48%) Terraform
3 1 (0.48%) Zustand
Miscellaneous
1 9 (4.33%) AI Agents
2 6 (2.88%) Data Centre
2 6 (2.88%) Data Fabric
2 6 (2.88%) Self-Motivation
3 4 (1.92%) Renewable Energy
3 4 (1.92%) Security Posture
4 3 (1.44%) Cloud Native
5 2 (0.96%) Life Science
5 2 (0.96%) Management Information System
5 2 (0.96%) NHS
6 1 (0.48%) Analytical Mindset
6 1 (0.48%) Digital Media
6 1 (0.48%) LLPG
6 1 (0.48%) Onboarding
6 1 (0.48%) PMI
6 1 (0.48%) Product Ownership
Operating Systems
1 5 (2.40%) Windows
Processes & Methodologies
1 22 (10.58%) Stakeholder Management
2 15 (7.21%) AI
3 14 (6.73%) Facilities Management
4 13 (6.25%) B2B
4 13 (6.25%) Technology Transformation
5 11 (5.29%) Business Strategy
5 11 (5.29%) Mentoring
5 11 (5.29%) Risk Management
5 11 (5.29%) Strategic Thinking
6 10 (4.81%) Digital Transformation Programme
7 9 (4.33%) Project Management
8 8 (3.85%) Agile
8 8 (3.85%) AI Transformation
8 8 (3.85%) B2B Sales
8 8 (3.85%) Coaching
8 8 (3.85%) CRM
8 8 (3.85%) Cybersecurity
8 8 (3.85%) Data Architecture
8 8 (3.85%) Decision-Making
8 8 (3.85%) Thought Leadership
Programming Languages
1 4 (1.92%) Python
1 4 (1.92%) SQL
2 2 (0.96%) PowerShell
2 2 (0.96%) TypeScript
3 1 (0.48%) Bash
3 1 (0.48%) Data Analysis Expressions
3 1 (0.48%) JavaScript
3 1 (0.48%) T-SQL
Qualifications
1 15 (7.21%) Microsoft Certification
2 12 (5.77%) Degree
3 8 (3.85%) Azure Certification
4 7 (3.37%) Security Cleared
5 4 (1.92%) (ISC)2 CCSP
5 4 (1.92%) CCSP
5 4 (1.92%) Cisco Certification
5 4 (1.92%) CISM
5 4 (1.92%) CISSP
5 4 (1.92%) Master's Degree
6 2 (0.96%) SC Cleared
7 1 (0.48%) ACCA
7 1 (0.48%) CIMA
7 1 (0.48%) Microsoft Certified Professional
7 1 (0.48%) PMI Certification
Quality Assurance & Compliance
1 6 (2.88%) ISO/IEC 27001
2 5 (2.40%) QA
3 4 (1.92%) NIST
4 2 (0.96%) Cyber Essentials
4 2 (0.96%) GDPR
5 1 (0.48%) Accessibility
5 1 (0.48%) Data Quality
System Software
1 2 (0.96%) Active Directory
2 1 (0.48%) Docker
Systems Management
1 1 (0.48%) Kubernetes
Vendors
1 24 (11.54%) Microsoft
2 7 (3.37%) OpenAI
3 6 (2.88%) Foundry
4 5 (2.40%) Google
4 5 (2.40%) HubSpot
4 5 (2.40%) Salesforce
5 3 (1.44%) Adobe
5 3 (1.44%) Oracle
6 2 (0.96%) Apple
6 2 (0.96%) SAP
7 1 (0.48%) ESRI
7 1 (0.48%) Proofpoint
7 1 (0.48%) ServiceNow
7 1 (0.48%) Zoho