DevOps Jobs in Central London

DevOps
London > Central London

The table below provides summary statistics for permanent job vacancies advertised in Central London requiring DevOps skills. It includes a benchmarking guide to the annual salaries offered in vacancies that cited DevOps over the 6 months leading up to 12 May 2025, comparing them to the same period in the previous two years.

6 months to
12 May 2025
Same period 2024 Same period 2023
Rank 13 17 8
Rank change year-on-year +4 -9 +2
Permanent jobs citing DevOps 356 417 984
As % of all permanent jobs advertised in Central London 14.19% 11.04% 19.02%
As % of the Processes & Methodologies category 14.72% 11.97% 20.06%
Number of salaries quoted 270 325 789
10th Percentile £54,875 £51,300 £53,100
25th Percentile £62,500 £65,500 £63,750
Median annual salary (50th Percentile) £77,500 £80,000 £80,000
Median % change year-on-year -3.13% - -
75th Percentile £97,500 £103,750 £97,500
90th Percentile £120,000 £115,000 £110,000
London median annual salary £82,500 £80,000 £80,000
% change year-on-year +3.13% - -

All Process and Methodology Skills
Central London

DevOps falls under the Processes and Methodologies category. For comparison with the information above, the following table provides summary statistics for all permanent job vacancies requiring process or methodology skills in Central London.

Permanent vacancies with a requirement for process or methodology skills 2,418 3,484 4,906
As % of all permanent jobs advertised in Central London 96.41% 92.22% 94.82%
Number of salaries quoted 1,653 2,700 4,054
10th Percentile £41,800 £40,000 £42,500
25th Percentile £55,000 £52,500 £55,000
Median annual salary (50th Percentile) £75,000 £72,500 £75,000
Median % change year-on-year +3.45% -3.33% +3.45%
75th Percentile £97,500 £95,000 £97,500
90th Percentile £120,000 £112,500 £112,500
London median annual salary £75,000 £70,555 £75,000
% change year-on-year +6.30% -5.93% +7.14%

DevOps
Job Vacancy Trend in Central London

Job postings citing DevOps as a proportion of all IT jobs advertised in Central London.
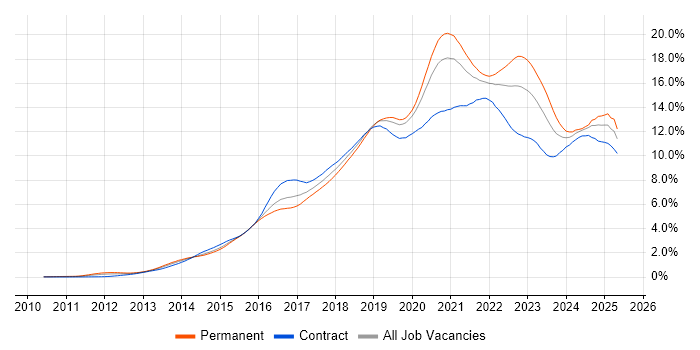
Job vacancy trend for DevOps in Central London

DevOps
Salary Trend in Central London

3-month moving average salary quoted in jobs citing DevOps in Central London.

Salary trend for DevOps in Central London

DevOps
Salary Histogram in Central London

Salary distribution for jobs citing DevOps in Central London over the 6 months to 12 May 2025.

Salary histogram for DevOps in Central London

DevOps
Job Locations in Central London

The table below looks at the demand and provides a guide to the median salaries quoted in IT jobs citing DevOps within the Central London region over the 6 months to 12 May 2025. The 'Rank Change' column provides an indication of the change in demand within each location based on the same 6 month period last year.

Location Rank Change
on Same Period
Last Year
Matching
Permanent
IT Job Ads
Median Salary
Past 6 Months
Median Salary
% Change
on Same Period
Last Year
Live
Jobs
City of London +2 306 £77,500 -3.13% 144
Camden +6 18 £70,000 - 4
City of Westminster -7 11 £61,339 -18.53% 2
West End of London +8 9 - - 41
Southwark -1 6 £60,000 -5.88%
Kensington and Chelsea 0 1 - -
Lambeth -1 1 - -
DevOps
London

DevOps
Co-occurring Skills and Capabilities in Central London by Category

The follow tables expand on the table above by listing co-occurrences grouped by category. The same employment type, locality and period is covered with up to 20 co-occurrences shown in each of the following categories:

Application Platforms
1 26 (7.30%) Confluence
2 17 (4.78%) SharePoint
3 5 (1.40%) CMS
3 5 (1.40%) nginx
4 3 (0.84%) Apache Airflow
5 2 (0.56%) Apache
5 2 (0.56%) Microsoft Exchange
5 2 (0.56%) Tomcat
6 1 (0.28%) Alfresco
6 1 (0.28%) Apache Spark
6 1 (0.28%) Camunda
6 1 (0.28%) Drupal
6 1 (0.28%) Headless CMS
6 1 (0.28%) Mule
6 1 (0.28%) Oracle SOA Suite
6 1 (0.28%) SharePoint Server
Applications
1 9 (2.53%) Microsoft Excel
2 7 (1.97%) Microsoft Project
3 2 (0.56%) Adobe XD
3 2 (0.56%) Microsoft Office
3 2 (0.56%) Sketch
4 1 (0.28%) MS Visio
Business Applications
1 22 (6.18%) Dynamics CRM
2 3 (0.84%) Orchestrade
2 3 (0.84%) Payment Gateway
3 1 (0.28%) Eikon
3 1 (0.28%) Oracle EBS
3 1 (0.28%) RMDS
3 1 (0.28%) SAP Payroll
3 1 (0.28%) Shopify
Cloud Services
1 216 (60.67%) Azure
2 108 (30.34%) AWS
3 97 (27.25%) Azure DevOps
4 64 (17.98%) GitHub
5 47 (13.20%) GitHub Actions
6 45 (12.64%) GCP
7 35 (9.83%) Power Platform
8 28 (7.87%) Dynamics 365
9 27 (7.58%) Serverless
10 24 (6.74%) PaaS
11 21 (5.90%) Azure Data Factory
12 16 (4.49%) Azure Synapse Analytics
12 16 (4.49%) Microsoft 365
13 15 (4.21%) Datadog
13 15 (4.21%) SaaS
14 14 (3.93%) AWS CloudFormation
15 11 (3.09%) Azure Monitor
15 11 (3.09%) npm
15 11 (3.09%) PowerApps
16 10 (2.81%) Amazon EKS
Communications & Networking
1 8 (2.25%) DNS
2 7 (1.97%) Broadband
2 7 (1.97%) VPN
3 3 (0.84%) Firewall
4 2 (0.56%) Multicast
4 2 (0.56%) SAN
4 2 (0.56%) VLAN
5 1 (0.28%) HTTP
5 1 (0.28%) Network Security
5 1 (0.28%) TCP/IP
Database & Business Intelligence
1 25 (7.02%) SQL Server
2 23 (6.46%) NoSQL
3 18 (5.06%) Power BI
4 17 (4.78%) PostgreSQL
4 17 (4.78%) Relational Database
5 16 (4.49%) Data Warehouse
6 15 (4.21%) MongoDB
7 11 (3.09%) MySQL
8 10 (2.81%) RDBMS
9 9 (2.53%) Data Lake
10 7 (1.97%) Tableau
11 6 (1.69%) Metadata
12 5 (1.40%) BigQuery
12 5 (1.40%) Semantic Layer
13 4 (1.12%) Data Vault
13 4 (1.12%) SQL Server Reporting Services
14 3 (0.84%) Big Data
14 3 (0.84%) OLAP
14 3 (0.84%) SQL Server Integration Services
15 2 (0.56%) OLTP
Development Applications
1 48 (13.48%) JIRA
2 46 (12.92%) Git
3 44 (12.36%) Jenkins
4 30 (8.43%) SonarQube
5 27 (7.58%) Maven
6 21 (5.90%) TeamCity
7 20 (5.62%) Ant
7 20 (5.62%) Sonatype Nexus
8 12 (3.37%) Bitbucket
8 12 (3.37%) Gradle
9 8 (2.25%) GitLab
10 7 (1.97%) Jaeger
11 6 (1.69%) CircleCI
12 4 (1.12%) Selenium
13 3 (0.84%) Babel
13 3 (0.84%) gulp
13 3 (0.84%) webpack
14 2 (0.56%) Artifactory
14 2 (0.56%) SpecFlow
14 2 (0.56%) Visual Studio Code
General
1 105 (29.49%) Social Skills
2 103 (28.93%) Finance
3 30 (8.43%) Banking
4 27 (7.58%) Analytical Skills
5 22 (6.18%) Inclusion and Diversity
6 18 (5.06%) Games
6 18 (5.06%) Retail
7 14 (3.93%) Law
8 10 (2.81%) Back Office
9 9 (2.53%) Investment Banking
9 9 (2.53%) Marketing
9 9 (2.53%) Public Sector
10 8 (2.25%) Front Office
11 5 (1.40%) Financial Institution
12 3 (0.84%) Fire and Rescue
12 3 (0.84%) French Language
12 3 (0.84%) Legal
12 3 (0.84%) Presentation Skills
13 2 (0.56%) Influencing Skills
13 2 (0.56%) Organisational Skills
Job Titles
1 86 (24.16%) Developer
2 71 (19.94%) Senior
3 61 (17.13%) Lead
4 39 (10.96%) Architect
5 38 (10.67%) DevOps Engineer
6 25 (7.02%) Analyst
6 25 (7.02%) Senior Developer
7 22 (6.18%) DevOps Architect
8 19 (5.34%) Team Leader
9 18 (5.06%) Lead Developer
10 16 (4.49%) Cloud Engineer
11 15 (4.21%) Azure Engineer
12 14 (3.93%) Software Engineer
13 11 (3.09%) Business Analyst
13 11 (3.09%) Platform Engineer
13 11 (3.09%) Senior DevOps
14 10 (2.81%) Data Engineer
14 10 (2.81%) Senior DevOps Engineer
14 10 (2.81%) Software Developer
14 10 (2.81%) Solutions Architect
Libraries, Frameworks & Software Standards
1 47 (13.20%) .NET
2 43 (12.08%) React
3 29 (8.15%) RESTful
4 23 (6.46%) .NET Framework
5 22 (6.18%) CSS
5 22 (6.18%) HTML
5 22 (6.18%) REST
6 16 (4.49%) Node.js
7 14 (3.93%) .NET Core
7 14 (3.93%) AngularJS
7 14 (3.93%) Spring
8 13 (3.65%) Elastic Stack
8 13 (3.65%) Vue
9 10 (2.81%) HTML5
9 10 (2.81%) Sass
10 9 (2.53%) OAuth
10 9 (2.53%) OpenTelemetry
11 8 (2.25%) ASP.NET Web API
12 7 (1.97%) React Native
12 7 (1.97%) Unity (Game Engine)
Miscellaneous
1 39 (10.96%) Cloud Native
2 17 (4.78%) Legacy Systems
3 16 (4.49%) Management Information System
4 15 (4.21%) Product Ownership
5 14 (3.93%) Onboarding
6 12 (3.37%) Mobile Games
7 10 (2.81%) Data Structures
8 9 (2.53%) CSOC
8 9 (2.53%) Mobile App
8 9 (2.53%) Security Operations Centre
8 9 (2.53%) Virtual Team
9 8 (2.25%) Public Cloud
10 6 (1.69%) Analytical Mindset
10 6 (1.69%) Security Posture
11 5 (1.40%) Reinsurance
12 4 (1.12%) Cloud Security Posture
12 4 (1.12%) Equities
12 4 (1.12%) Foreign Exchange (FX)
12 4 (1.12%) PMI
13 3 (0.84%) Blog
Operating Systems
1 56 (15.73%) Linux
2 13 (3.65%) Unix
3 9 (2.53%) Red Hat Enterprise Linux
4 8 (2.25%) Android
4 8 (2.25%) Apple iOS
4 8 (2.25%) Windows
5 4 (1.12%) CentOS
5 4 (1.12%) Windows Server
6 3 (0.84%) Ubuntu
7 2 (0.56%) Rocky
8 1 (0.28%) Amazon Linux
8 1 (0.28%) Solaris
8 1 (0.28%) Windows Server 2016
Processes & Methodologies
1 168 (47.19%) Agile
2 166 (46.63%) CI/CD
3 86 (24.16%) Infrastructure as Code
4 71 (19.94%) Mentoring
5 70 (19.66%) Problem-Solving
6 56 (15.73%) Containerisation
7 55 (15.45%) Microservices
7 55 (15.45%) Software Engineering
8 47 (13.20%) Migration
9 41 (11.52%) Continuous Integration
10 40 (11.24%) Test Automation
11 37 (10.39%) Continuous Improvement
12 30 (8.43%) Computer Science
13 29 (8.15%) Release Management
13 29 (8.15%) Roadmaps
13 29 (8.15%) Technical Leadership
14 27 (7.58%) Platform Engineering
14 27 (7.58%) Scrum
14 27 (7.58%) Static Code Analysis
15 26 (7.30%) CRM
Programming Languages
1 97 (27.25%) Python
2 74 (20.79%) SQL
3 72 (20.22%) JavaScript
4 71 (19.94%) Java
5 52 (14.61%) C#
6 36 (10.11%) Bash
7 29 (8.15%) TypeScript
8 28 (7.87%) PowerShell
9 15 (4.21%) Go
10 8 (2.25%) Kotlin
11 7 (1.97%) C++
11 7 (1.97%) Objective-C
11 7 (1.97%) Swift
12 5 (1.40%) Bicep
12 5 (1.40%) C
12 5 (1.40%) R
12 5 (1.40%) Ruby
13 4 (1.12%) Apex Code
13 4 (1.12%) T-SQL
14 3 (0.84%) PHP
Qualifications
1 57 (16.01%) Degree
2 27 (7.58%) Security Cleared
3 24 (6.74%) Computer Science Degree
4 17 (4.78%) AWS Certification
4 17 (4.78%) SC Cleared
5 15 (4.21%) DBS Check
6 11 (3.09%) Microsoft Certification
7 8 (2.25%) Azure Certification
8 6 (1.69%) AWS Certified Solutions Architect
8 6 (1.69%) Master's Degree
9 4 (1.12%) PMI Certification
9 4 (1.12%) PMP
9 4 (1.12%) RHCSA
9 4 (1.12%) TOGAF Certification
10 3 (0.84%) GIAC
11 2 (0.56%) PhD
12 1 (0.28%) AWS Certified DevOps Engineer
12 1 (0.28%) AWS Certified SysOps Administrator
12 1 (0.28%) ISTQB
12 1 (0.28%) Postgraduate
Quality Assurance & Compliance
1 35 (9.83%) QA
2 9 (2.53%) GDPR
3 3 (0.84%) Data Quality
4 2 (0.56%) Accessibility
4 2 (0.56%) PCI DSS
4 2 (0.56%) SLA
5 1 (0.28%) CDISC
5 1 (0.28%) HIPAA
5 1 (0.28%) ISO/IEC 27001
5 1 (0.28%) MiFID
5 1 (0.28%) PMO
5 1 (0.28%) PSD2
5 1 (0.28%) SOC 2
System Software
1 50 (14.04%) Docker
2 14 (3.93%) VMware Infrastructure
3 8 (2.25%) Virtual Desktop
4 4 (1.12%) Active Directory
5 1 (0.28%) Apache ZooKeeper
Systems Management
1 85 (23.88%) Terraform
2 70 (19.66%) Kubernetes
3 47 (13.20%) Ansible
4 30 (8.43%) Prometheus
5 15 (4.21%) Argo
6 12 (3.37%) Grafana
7 9 (2.53%) Progress Chef
7 9 (2.53%) QRadar
8 8 (2.25%) Nagios
9 7 (1.97%) Kustomize
10 6 (1.69%) Puppet
11 4 (1.12%) Consul
11 4 (1.12%) Istio
12 2 (0.56%) Microsoft Intune
12 2 (0.56%) Red Hat Satellite
12 2 (0.56%) Single Sign-On
13 1 (0.28%) CloudHub
13 1 (0.28%) Packer
13 1 (0.28%) Salt
Vendors
1 77 (21.63%) Microsoft
2 28 (7.87%) Google
3 22 (6.18%) Databricks
4 16 (4.49%) VMware
5 15 (4.21%) New Relic
5 15 (4.21%) Red Hat
6 10 (2.81%) Citrix
7 8 (2.25%) Salesforce
7 8 (2.25%) Siebel
7 8 (2.25%) SolarWinds
8 5 (1.40%) Guidewire
8 5 (1.40%) Oracle
9 4 (1.12%) Adobe
9 4 (1.12%) Cisco
9 4 (1.12%) SAP
9 4 (1.12%) Splunk
10 3 (0.84%) Barracuda Networks
10 3 (0.84%) Dynatrace
10 3 (0.84%) Informatica
10 3 (0.84%) ServiceNow