Derivatives
Central London > City of London
The table below looks at the prevalence of the term Derivative in permanent job vacancies in the City of London. Included is a benchmarking guide to the salaries offered in vacancies that cited Derivative over the 6 months leading up to 19 February 2026, comparing them to the same period in the previous two years.
| 6 months to 19 Feb 2026 |
Same period 2025 | Same period 2024 | |
|---|---|---|---|
| Rank | 121 | 138 | 146 |
| Rank change year-on-year | +17 | +8 | +38 |
| Permanent jobs citing Derivative | 27 | 22 | 23 |
| As % of all permanent jobs in the City of London | 0.97% | 0.87% | 0.74% |
| As % of the Miscellaneous category | 3.00% | 2.06% | 2.16% |
| Number of salaries quoted | 22 | 20 | 20 |
| 10th Percentile | £72,625 | £68,625 | £62,875 |
| 25th Percentile | £87,500 | £70,000 | £63,750 |
| Median annual salary (50th Percentile) | £115,000 | £100,000 | £113,750 |
| Median % change year-on-year | +15.00% | -12.09% | +8.33% |
| 75th Percentile | £141,875 | £121,875 | £127,500 |
| 90th Percentile | £168,000 | £141,750 | £142,750 |
| Central London median annual salary | £115,000 | £100,000 | £113,750 |
| % change year-on-year | +15.00% | -12.09% | +8.33% |
All Generic Skills
City of London
Derivative falls under the General and Transferable Skills category. For comparison with the information above, the following table provides summary statistics for all permanent job vacancies requiring generic IT skills in the City of London.
| Permanent vacancies with a requirement for generic IT skills | 900 | 1,069 | 1,066 |
| As % of all permanent jobs advertised in the City of London | 32.23% | 42.49% | 34.50% |
| Number of salaries quoted | 671 | 659 | 915 |
| 10th Percentile | £42,500 | £42,400 | £37,500 |
| 25th Percentile | £56,875 | £55,000 | £47,750 |
| Median annual salary (50th Percentile) | £75,000 | £75,000 | £73,000 |
| Median % change year-on-year | - | +2.74% | -8.75% |
| 75th Percentile | £100,000 | £96,875 | £97,500 |
| 90th Percentile | £115,000 | £120,000 | £122,500 |
| Central London median annual salary | £75,000 | £72,500 | £72,500 |
| % change year-on-year | +3.45% | - | -6.45% |
Derivative
Job Vacancy Trend in the City of London
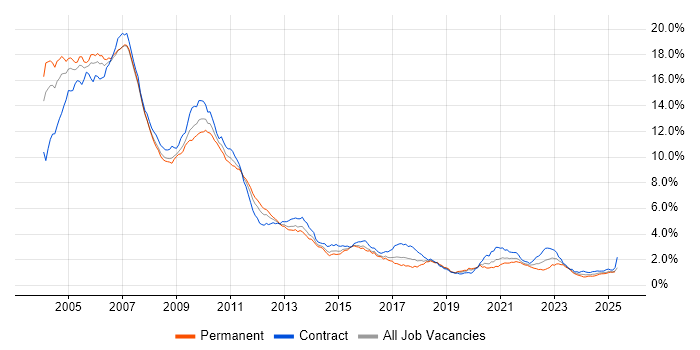
Historical trend showing the proportion of permanent IT job postings citing Derivative relative to all permanent IT jobs advertised in the City of London.

Derivative
Salary Trend in the City of London
Salary distribution trend for jobs in the City of London citing Derivative.

Derivative
Salary Histogram in the City of London
Salary distribution for jobs citing Derivative in the City of London over the 6 months to 19 February 2026.
Derivative
Co-Occurring Skills & Capabilities in the City of London by Category
The following tables expand on the one above by listing co-occurrences grouped by category. They cover the same employment type, locality and period, with up to 20 co-occurrences shown in each category:
