Git Jobs in the City of London

Git Distributed Version Control System
Central London > City of London

The table below provides summary statistics for permanent job vacancies advertised in the City of London requiring Git skills. It includes a benchmarking guide to the annual salaries offered in vacancies that cited Git over the 6 months leading up to 30 May 2025, comparing them to the same period in the previous two years.

6 months to
30 May 2025
Same period 2024 Same period 2023
Rank 61 36 59
Rank change year-on-year -25 +23 -20
Permanent jobs citing Git 80 206 218
As % of all permanent jobs advertised in the City of London 4.13% 6.17% 4.84%
As % of the Development Applications category 33.33% 40.79% 25.17%
Number of salaries quoted 64 120 195
10th Percentile £42,500 £46,250 £51,250
25th Percentile £52,000 £52,500 £61,875
Median annual salary (50th Percentile) £72,500 £73,750 £80,000
Median % change year-on-year -1.69% -7.81% -
75th Percentile £90,000 £94,063 £103,750
90th Percentile £115,250 £107,500 £137,500
Central London median annual salary £70,000 £72,500 £77,500
% change year-on-year -3.45% -6.45% -3.13%

All Development Application Skills
City of London

Git falls under the Development Applications category. For comparison with the information above, the following table provides summary statistics for all permanent job vacancies requiring development application skills in the City of London.

Permanent vacancies with a requirement for development application skills 240 505 866
As % of all permanent jobs advertised in the City of London 12.38% 15.12% 19.24%
Number of salaries quoted 197 370 773
10th Percentile £47,500 £47,500 £51,050
25th Percentile £55,000 £61,250 £62,500
Median annual salary (50th Percentile) £72,500 £85,000 £80,000
Median % change year-on-year -14.71% +6.25% +10.34%
75th Percentile £90,000 £102,500 £100,000
90th Percentile £115,000 £115,000 £110,000
Central London median annual salary £72,500 £80,000 £77,500
% change year-on-year -9.38% +3.23% +6.90%

Git
Job Vacancy Trend in the City of London

Job postings citing Git as a proportion of all IT jobs advertised in the City of London.
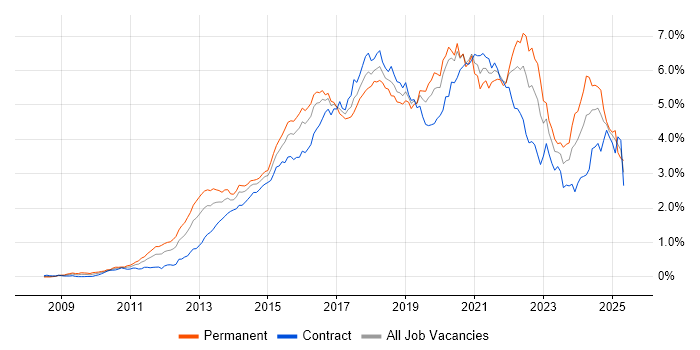
Job vacancy trend for Git in the City of London

Git
Salary Trend in the City of London

3-month moving average salary quoted in jobs citing Git in the City of London.

Salary trend for Git in the City of London

Git
Salary Histogram in the City of London

Salary distribution for jobs citing Git in the City of London over the 6 months to 30 May 2025.

Salary histogram for Git in the City of London

Git
Co-occurring Skills and Capabilities in the City of London by Category

The follow tables expand on the table above by listing co-occurrences grouped by category. The same employment type, locality and period is covered with up to 20 co-occurrences shown in each of the following categories:

Application Platforms
1 5 (6.25%) CMS
1 5 (6.25%) Microsoft Exchange
2 4 (5.00%) WordPress
3 2 (2.50%) Apache Airflow
3 2 (2.50%) Confluence
3 2 (2.50%) nginx
3 2 (2.50%) SharePoint
3 2 (2.50%) Tomcat
4 1 (1.25%) Apache
4 1 (1.25%) Drupal
4 1 (1.25%) IIS
Applications
1 6 (7.50%) Microsoft Excel
2 3 (3.75%) Microsoft Office
Cloud Services
1 26 (32.50%) Azure
2 19 (23.75%) AWS
3 7 (8.75%) GCP
3 7 (8.75%) GitHub
4 5 (6.25%) Serverless
5 4 (5.00%) Azure DevOps
6 3 (3.75%) Amazon EC2
6 3 (3.75%) Amazon S3
6 3 (3.75%) AWS CloudFormation
6 3 (3.75%) AWS Lambda
6 3 (3.75%) Boomi
6 3 (3.75%) Power Platform
7 2 (2.50%) Amazon CloudWatch
7 2 (2.50%) Azure App Service
7 2 (2.50%) Azure Pipelines
7 2 (2.50%) Cloud Computing
7 2 (2.50%) GitHub Actions
7 2 (2.50%) Microsoft 365
7 2 (2.50%) OneDrive
7 2 (2.50%) PaaS
Communications & Networking
1 3 (3.75%) DNS
2 2 (2.50%) Multicast
2 2 (2.50%) Telnet
2 2 (2.50%) VLAN
Database & Business Intelligence
1 10 (12.50%) Tableau
2 7 (8.75%) Relational Database
3 6 (7.50%) MySQL
3 6 (7.50%) SQL Server
4 4 (5.00%) Elasticsearch
5 3 (3.75%) Data Lake
5 3 (3.75%) MongoDB
6 2 (2.50%) Azure SQL Database
6 2 (2.50%) Data Warehouse
6 2 (2.50%) PostgreSQL
7 1 (1.25%) Amazon RDS
7 1 (1.25%) Big Data
7 1 (1.25%) BigQuery
7 1 (1.25%) Looker
7 1 (1.25%) Parquet
7 1 (1.25%) Power BI
7 1 (1.25%) PowerPivot
7 1 (1.25%) QlikView
7 1 (1.25%) Redis
7 1 (1.25%) SQL Server Integration Services
Development Applications
1 7 (8.75%) JIRA
2 4 (5.00%) Jasmine
3 3 (3.75%) Mocha
3 3 (3.75%) PHPUnit
4 2 (2.50%) Artifactory
4 2 (2.50%) Bitbucket
4 2 (2.50%) GitLab
4 2 (2.50%) Jenkins
4 2 (2.50%) NUnit
4 2 (2.50%) Octopus Deploy
4 2 (2.50%) Selenium
5 1 (1.25%) Babel
5 1 (1.25%) Postman
5 1 (1.25%) TeamCity
5 1 (1.25%) Visual Studio Code
5 1 (1.25%) webpack
General
1 38 (47.50%) Finance
2 25 (31.25%) Social Skills
3 16 (20.00%) Analytical Skills
4 15 (18.75%) Banking
5 9 (11.25%) Advertising
6 7 (8.75%) Presentation Skills
7 6 (7.50%) Retail
8 4 (5.00%) Marketing
9 3 (3.75%) Back Office
9 3 (3.75%) Inclusion and Diversity
10 2 (2.50%) Law
11 1 (1.25%) Billing
11 1 (1.25%) Financial Institution
11 1 (1.25%) Legal
11 1 (1.25%) Public Sector
Job Titles
1 32 (40.00%) Developer
2 20 (25.00%) Senior
3 13 (16.25%) Analyst
4 8 (10.00%) Software Engineer
5 7 (8.75%) Data Analyst
5 7 (8.75%) Python Developer
6 6 (7.50%) DevOps Engineer
6 6 (7.50%) Senior Analyst
6 6 (7.50%) Senior Data Analyst
6 6 (7.50%) Senior Developer
7 5 (6.25%) Banking Analyst
7 5 (6.25%) Full-Stack Developer
7 5 (6.25%) Lead
8 4 (5.00%) Data Scientist
8 4 (5.00%) Junior
8 4 (5.00%) Quantitative Developer
8 4 (5.00%) React Developer
9 3 (3.75%) Operations Analyst
9 3 (3.75%) PHP Developer
9 3 (3.75%) Senior Software Engineer
Libraries, Frameworks & Software Standards
1 26 (32.50%) React
2 15 (18.75%) HTML
3 13 (16.25%) CSS
4 9 (11.25%) Django
4 9 (11.25%) Next.js
4 9 (11.25%) REST
5 8 (10.00%) .NET
5 8 (10.00%) Node.js
6 7 (8.75%) .NET Framework
6 7 (8.75%) HTML5
6 7 (8.75%) RESTful
6 7 (8.75%) Vue
7 6 (7.50%) AngularJS
7 6 (7.50%) FIX Protocol
7 6 (7.50%) Jest
7 6 (7.50%) Pandas
7 6 (7.50%) Sass
8 5 (6.25%) GraphQL
8 5 (6.25%) jQuery
9 4 (5.00%) PySpark
Miscellaneous
1 6 (7.50%) Reinsurance
2 3 (3.75%) Algorithms
2 3 (3.75%) Cloud Native
2 3 (3.75%) Credit Risk
2 3 (3.75%) Equities
2 3 (3.75%) Hybrid Cloud
2 3 (3.75%) Reference Data
3 2 (2.50%) Derivative
3 2 (2.50%) Fixed Income
3 2 (2.50%) Legacy Systems
3 2 (2.50%) Onboarding
4 1 (1.25%) Distributed Systems
4 1 (1.25%) Equity Derivative
4 1 (1.25%) Foreign Exchange (FX)
4 1 (1.25%) Greenfield Project
4 1 (1.25%) Hedge funds
4 1 (1.25%) Linux Command Line
4 1 (1.25%) Multi-touch
4 1 (1.25%) Private Cloud
4 1 (1.25%) Product Ownership
Operating Systems
1 25 (31.25%) Linux
2 11 (13.75%) Red Hat Enterprise Linux
3 7 (8.75%) Unix
3 7 (8.75%) Windows
4 6 (7.50%) CentOS
5 5 (6.25%) Windows Server
6 4 (5.00%) Rocky
7 2 (2.50%) Ubuntu
8 1 (1.25%) Amazon Linux
8 1 (1.25%) CoreOS
8 1 (1.25%) VMS
Processes & Methodologies
1 27 (33.75%) DevOps
2 23 (28.75%) CI/CD
3 21 (26.25%) Analytics
4 20 (25.00%) Agile
5 17 (21.25%) Problem-Solving
6 16 (20.00%) Visualisation
7 14 (17.50%) Full-Stack Development
8 13 (16.25%) Containerisation
8 13 (16.25%) Infrastructure as Code
9 12 (15.00%) Root Cause Analysis
9 12 (15.00%) Software Engineering
10 9 (11.25%) Artificial Intelligence
10 9 (11.25%) Data Science
10 9 (11.25%) Storytelling
11 8 (10.00%) Data Pipeline
11 8 (10.00%) OO
11 8 (10.00%) OOP
11 8 (10.00%) TDD
12 7 (8.75%) Mathematics
12 7 (8.75%) Statistics
Programming Languages
1 53 (66.25%) Python
2 36 (45.00%) SQL
3 30 (37.50%) JavaScript
4 16 (20.00%) Bash
5 10 (12.50%) TypeScript
6 8 (10.00%) PowerShell
7 7 (8.75%) C#
8 6 (7.50%) PHP
9 2 (2.50%) PL/SQL
9 2 (2.50%) T-SQL
10 1 (1.25%) Apex Code
10 1 (1.25%) Go
10 1 (1.25%) Java
10 1 (1.25%) R
10 1 (1.25%) Scala
10 1 (1.25%) Shell Script
Qualifications
1 17 (21.25%) Degree
2 9 (11.25%) DBS Check
3 7 (8.75%) Master's Degree
4 4 (5.00%) Computer Science Degree
4 4 (5.00%) PhD
5 3 (3.75%) Security Cleared
6 2 (2.50%) Azure Certification
7 1 (1.25%) RHCSA
Quality Assurance & Compliance
1 6 (7.50%) QA
2 3 (3.75%) Accessibility
3 2 (2.50%) SLA
4 1 (1.25%) Data Quality
System Software
1 13 (16.25%) Docker
2 6 (7.50%) VMware Infrastructure
3 3 (3.75%) VMware ESXi
4 2 (2.50%) Active Directory
4 2 (2.50%) Firmware
Systems Management
1 18 (22.50%) Kubernetes
2 16 (20.00%) Ansible
3 13 (16.25%) Terraform
4 5 (6.25%) Grafana
4 5 (6.25%) Nagios
5 2 (2.50%) Kibana
5 2 (2.50%) logstash
5 2 (2.50%) Microsoft Intune
5 2 (2.50%) Progress Chef
5 2 (2.50%) Red Hat Satellite
6 1 (1.25%) Puppet
Vendors
1 17 (21.25%) Microsoft
2 12 (15.00%) Databricks
3 9 (11.25%) VMware
4 8 (10.00%) Red Hat
5 3 (3.75%) Cisco
5 3 (3.75%) Commvault
5 3 (3.75%) Pure Storage
5 3 (3.75%) SolarWinds
6 2 (2.50%) Atlassian
6 2 (2.50%) Oracle
6 2 (2.50%) Rapid7
6 2 (2.50%) ServiceNow
6 2 (2.50%) Splunk
7 1 (1.25%) Alteryx
7 1 (1.25%) Dell
7 1 (1.25%) Google
7 1 (1.25%) Jitterbit
7 1 (1.25%) MuleSoft
7 1 (1.25%) Salesforce
7 1 (1.25%) Zuora