Java Job Trends in the City of London

Java
Central London > City of London

The table below provides summary statistics and salary benchmarking for jobs advertised in the City of London requiring Java skills. It covers vacancies from the 6 months leading up to 16 September 2025, with comparisons to the same periods in the previous two years.

6 months to
16 Sep 2025
Same period 2024 Same period 2023
Rank 19 27 8
Rank change year-on-year +8 -19 +3
Permanent jobs citing Java 190 215 597
As % of all permanent jobs advertised in the City of London 11.07% 7.55% 17.17%
As % of the Programming Languages category 26.46% 16.36% 33.26%
Number of salaries quoted 163 174 550
10th Percentile £57,500 £65,000 £53,750
25th Percentile £73,750 £67,500 £67,500
Median annual salary (50th Percentile) £90,000 £85,000 £92,500
Median % change year-on-year +5.88% -8.11% +2.78%
75th Percentile £120,000 £107,500 £113,750
90th Percentile £140,000 £120,000 £131,250
Central London median annual salary £90,000 £85,000 £90,000
% change year-on-year +5.88% -5.56% -

All Programming Languages
City of London

Java falls under the Programming Languages category. For comparison with the information above, the following table provides summary statistics for all permanent job vacancies requiring coding skills in the City of London.

Permanent vacancies with a requirement for coding skills 718 1,314 1,795
As % of all permanent jobs advertised in the City of London 41.84% 46.15% 51.64%
Number of salaries quoted 600 926 1,661
10th Percentile £52,500 £50,000 £50,000
25th Percentile £61,250 £56,250 £58,750
Median annual salary (50th Percentile) £80,000 £76,000 £77,500
Median % change year-on-year +5.26% -1.94% +3.33%
75th Percentile £111,250 £95,938 £100,000
90th Percentile £132,500 £113,125 £118,750
Central London median annual salary £80,000 £75,000 £77,500
% change year-on-year +6.67% -3.23% +3.33%

Java
Job Vacancy Trend in the City of London

Job postings citing Java as a proportion of all IT jobs advertised in the City of London.
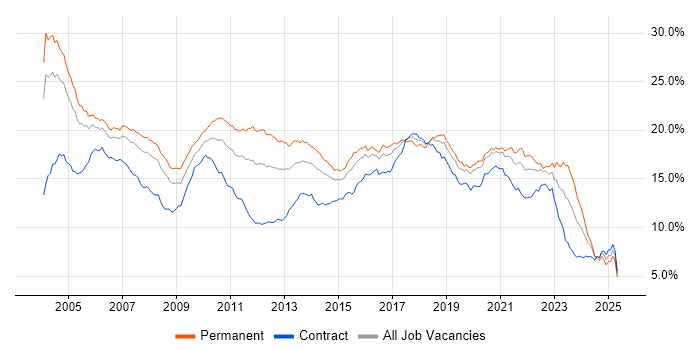
Job vacancy trend for Java in the City of London

Java
Salary Trend in the City of London

Salary distribution trend for jobs in the City of London citing Java.

Salary distribution trend for jobs in the City of London citing Java

Java
Salary Histogram in the City of London

Salary distribution for jobs citing Java in the City of London over the 6 months to 16 September 2025.

Salary histogram for Java in the City of London

Java
Co-occurring Skills and Capabilities in the City of London by Category

The follow tables expand on the table above by listing co-occurrences grouped by category. The same employment type, locality and period is covered with up to 20 co-occurrences shown in each of the following categories:

Application Platforms
1 4 (2.11%) Microsoft Exchange
2 3 (1.58%) Apache Spark
3 2 (1.05%) Apache Airflow
3 2 (1.05%) Confluence
3 2 (1.05%) Ethereum
3 2 (1.05%) Luigi
3 2 (1.05%) Oracle SOA Suite
3 2 (1.05%) Solana
4 1 (0.53%) Alfresco
4 1 (0.53%) Apache
4 1 (0.53%) Camunda
4 1 (0.53%) CMS
Applications
1 1 (0.53%) MS Visio
Business Applications
1 5 (2.63%) Adaptiv
2 4 (2.11%) Endur
2 4 (2.11%) Payment Gateway
2 4 (2.11%) SimCorp Dimension
3 1 (0.53%) Shopify
Cloud Services
1 61 (32.11%) AWS
2 52 (27.37%) Azure
3 25 (13.16%) GCP
4 23 (12.11%) Datadog
5 19 (10.00%) GitHub
6 16 (8.42%) Azure DevOps
7 15 (7.89%) GitHub Actions
8 13 (6.84%) Serverless
9 9 (4.74%) AWS Lambda
10 6 (3.16%) AWS CloudFormation
10 6 (3.16%) SaaS
11 5 (2.63%) Amazon ECS
11 5 (2.63%) Amazon S3
12 4 (2.11%) Amazon Kinesis
12 4 (2.11%) Amazon SQS
12 4 (2.11%) AWS Step Functions
12 4 (2.11%) Virtual Private Cloud
13 3 (1.58%) npm
13 3 (1.58%) OpenShift
13 3 (1.58%) Power Platform
Database & Business Intelligence
1 27 (14.21%) Relational Database
2 12 (6.32%) SQL Server
3 8 (4.21%) ClickHouse
4 7 (3.68%) PostgreSQL
5 5 (2.63%) Big Data
5 5 (2.63%) Hadoop
5 5 (2.63%) RDBMS
6 4 (2.11%) Data Lake
6 4 (2.11%) DynamoDB
6 4 (2.11%) NoSQL
6 4 (2.11%) OLAP
6 4 (2.11%) OLTP
7 3 (1.58%) Elasticsearch
7 3 (1.58%) MongoDB
7 3 (1.58%) Power BI
8 2 (1.05%) Apache Cassandra
8 2 (1.05%) SQL Server Analysis Services
8 2 (1.05%) SQL Server Integration Services
8 2 (1.05%) SQL Server Reporting Services
8 2 (1.05%) Tableau
Development Applications
1 8 (4.21%) SonarQube
2 6 (3.16%) JIRA
3 3 (1.58%) Git
3 3 (1.58%) Jenkins
3 3 (1.58%) JUnit
3 3 (1.58%) Selenium
4 2 (1.05%) Atlassian Bamboo
4 2 (1.05%) Bitbucket
4 2 (1.05%) JMeter
4 2 (1.05%) TeamCity
4 2 (1.05%) WebDriver
5 1 (0.53%) CircleCI
5 1 (0.53%) Cucumber
5 1 (0.53%) Katalon Studio
5 1 (0.53%) Vagrant
General
1 51 (26.84%) Finance
1 51 (26.84%) Social Skills
2 37 (19.47%) Banking
3 25 (13.16%) Front Office
4 17 (8.95%) Billing
5 14 (7.37%) Analytical Skills
6 13 (6.84%) Investment Banking
7 9 (4.74%) Financial Institution
8 8 (4.21%) Inclusion and Diversity
8 8 (4.21%) Law
9 4 (2.11%) Public Sector
10 3 (1.58%) Advertising
11 2 (1.05%) Retail
12 1 (0.53%) Retail Banking
Job Titles
1 89 (46.84%) Developer
2 29 (15.26%) Lead
3 28 (14.74%) Senior
4 20 (10.53%) Java Developer
5 14 (7.37%) DevOps Engineer
6 13 (6.84%) Senior Developer
7 12 (6.32%) Software Engineer
8 10 (5.26%) Java Engineer
9 8 (4.21%) Analyst
9 8 (4.21%) Data Engineer
9 8 (4.21%) Head of IT
10 7 (3.68%) Platform Engineer
10 7 (3.68%) Python Developer
11 6 (3.16%) Lead Data Engineer
12 5 (2.63%) Development Team Leader
12 5 (2.63%) Electronic Trading Developer
12 5 (2.63%) Electronic Trading Java Developer
12 5 (2.63%) Qualitative Analyst
12 5 (2.63%) Quantitative Analyst
12 5 (2.63%) Team Leader
Libraries, Frameworks & Software Standards
1 38 (20.00%) .NET
2 30 (15.79%) React
3 22 (11.58%) Kafka
3 22 (11.58%) RESTful
4 18 (9.47%) Spring
5 10 (5.26%) Node.js
5 10 (5.26%) Spring Boot
6 6 (3.16%) ARM Templates
7 5 (2.63%) RabbitMQ
8 4 (2.11%) Django
8 4 (2.11%) Flask
8 4 (2.11%) HTML
8 4 (2.11%) Java Concurrency
8 4 (2.11%) JSON
8 4 (2.11%) REST
9 3 (1.58%) Middleware
9 3 (1.58%) Pandas
10 2 (1.05%) CSS
10 2 (1.05%) FIX Protocol
10 2 (1.05%) JPA
Miscellaneous
1 40 (21.05%) Onboarding
2 38 (20.00%) Cloud Native
3 16 (8.42%) Algorithms
4 13 (6.84%) Equities
5 11 (5.79%) Distributed Systems
5 11 (5.79%) Market Risk
6 9 (4.74%) Derivative
7 6 (3.16%) Greenfield Project
8 5 (2.63%) Credit Risk
8 5 (2.63%) Data Structures
8 5 (2.63%) Fixed Income
8 5 (2.63%) Public Cloud
9 4 (2.11%) Product Ownership
9 4 (2.11%) Swaptions
10 3 (1.58%) Blockchain
10 3 (1.58%) Cyberattack
10 3 (1.58%) Foreign Exchange (FX)
11 2 (1.05%) Bitcoin
11 2 (1.05%) Mobile App
11 2 (1.05%) Sports Betting
Operating Systems
1 8 (4.21%) Linux
2 3 (1.58%) Android
3 1 (0.53%) Unix
3 1 (0.53%) Windows
Processes & Methodologies
1 82 (43.16%) Agile
2 67 (35.26%) DevOps
3 60 (31.58%) Migration
4 59 (31.05%) CI/CD
5 39 (20.53%) Microservices
5 39 (20.53%) Problem-Solving
6 37 (19.47%) Continuous Improvement
7 34 (17.89%) Stakeholder Management
8 30 (15.79%) Containerisation
9 29 (15.26%) Computer Science
9 29 (15.26%) Test Automation
10 28 (14.74%) Analytics
10 28 (14.74%) Scrum
10 28 (14.74%) Software Engineering
11 25 (13.16%) Low Latency
12 22 (11.58%) Collaborative Working
13 21 (11.05%) Code Quality
13 21 (11.05%) Platform Engineering
14 20 (10.53%) Error Analysis
14 20 (10.53%) Requirements Gathering
Programming Languages
1 98 (51.58%) Python
2 60 (31.58%) C#
3 34 (17.89%) SQL
4 23 (12.11%) C++
5 14 (7.37%) TypeScript
6 12 (6.32%) Go
7 10 (5.26%) Scala
8 9 (4.74%) JavaScript
9 7 (3.68%) Rust
10 4 (2.11%) Bash
10 4 (2.11%) PowerShell
10 4 (2.11%) VB
11 3 (1.58%) Kotlin
11 3 (1.58%) MATLAB
12 1 (0.53%) Groovy
12 1 (0.53%) R
12 1 (0.53%) Ruby
12 1 (0.53%) Solidity
12 1 (0.53%) T-SQL
Qualifications
1 30 (15.79%) Degree
2 22 (11.58%) Master's Degree
3 14 (7.37%) Computer Science Degree
4 13 (6.84%) Security Cleared
5 10 (5.26%) DV Cleared
6 8 (4.21%) CFA
6 8 (4.21%) ITIL Certification
6 8 (4.21%) PMI Certification
6 8 (4.21%) PMP
7 7 (3.68%) PhD
8 3 (1.58%) SC Cleared
Quality Assurance & Compliance
1 8 (4.21%) QA
2 5 (2.63%) GDPR
3 4 (2.11%) PCI DSS
3 4 (2.11%) SLA
4 1 (0.53%) Data Quality
4 1 (0.53%) HIPAA
4 1 (0.53%) ITGC
System Software
1 26 (13.68%) Docker
2 1 (0.53%) Apache ZooKeeper
Systems Management
1 31 (16.32%) Kubernetes
2 19 (10.00%) Terraform
3 7 (3.68%) Ansible
4 4 (2.11%) Prometheus
4 4 (2.11%) Single Sign-On
5 3 (1.58%) Progress Chef
5 3 (1.58%) Puppet
6 1 (0.53%) Consul
6 1 (0.53%) Grafana
6 1 (0.53%) Istio
6 1 (0.53%) Packer
6 1 (0.53%) Salt
Vendors
1 38 (20.00%) Guidewire
2 14 (7.37%) Google
3 8 (4.21%) Microsoft
3 8 (4.21%) Murex
3 8 (4.21%) Oracle
4 5 (2.63%) FIS
4 5 (2.63%) Solace
5 4 (2.11%) OpenLink
5 4 (2.11%) SimCorp
5 4 (2.11%) Sybase
5 4 (2.11%) TIBCO
6 3 (1.58%) Informatica
6 3 (1.58%) ServiceNow
7 2 (1.05%) Databricks
8 1 (0.53%) Atlassian
8 1 (0.53%) Pega
8 1 (0.53%) Talend