Decision-Making Jobs in Reading

Decision-Making
Berkshire > Reading

The following table provides summary statistics for permanent job vacancies advertised in Reading with a requirement for Decision-Making skills. Included is a benchmarking guide to the salaries offered in vacancies that have cited Decision-Making over the 6 months to 27 May 2024 with a comparison to the same period in the previous 2 years.

6 months to
27 May 2024
Same period 2023 Same period 2022
Rank 40 105 36
Rank change year-on-year +65 -69 +23
Permanent jobs citing Decision-Making 95 29 128
As % of all permanent jobs advertised in Reading 5.31% 1.88% 6.86%
As % of the Processes & Methodologies category 6.08% 1.93% 7.40%
Number of salaries quoted 72 9 45
10th Percentile £38,880 £54,500 £48,750
25th Percentile £48,825 £55,500 £62,500
Median annual salary (50th Percentile) £53,773 £64,500 £77,500
Median % change year-on-year -16.63% -16.77% +16.54%
75th Percentile £65,000 £92,500 £81,250
90th Percentile £72,375 £97,300 £88,750
Berkshire median annual salary £52,550 £50,000 £77,500
% change year-on-year +5.10% -35.48% +16.54%

All Process and Methodology Skills
Reading

Decision-Making is in the Processes and Methodologies category. The following table is for comparison with the above and provides summary statistics for all permanent job vacancies advertised in Reading with a requirement for process or methodology skills.

Permanent vacancies with a requirement for process or methodology skills 1,562 1,500 1,730
As % of all permanent jobs advertised in Reading 87.26% 97.15% 92.71%
Number of salaries quoted 928 761 958
10th Percentile £30,000 £31,250 £32,500
25th Percentile £40,938 £42,500 £45,000
Median annual salary (50th Percentile) £54,748 £62,500 £60,000
Median % change year-on-year -12.40% +4.17% -
75th Percentile £70,000 £77,500 £75,000
90th Percentile £80,000 £95,000 £82,500
Berkshire median annual salary £53,263 £60,000 £60,000
% change year-on-year -11.23% - +9.09%

Decision-Making
Job Vacancy Trend in Reading

Job postings citing Decision-Making as a proportion of all IT jobs advertised in Reading.
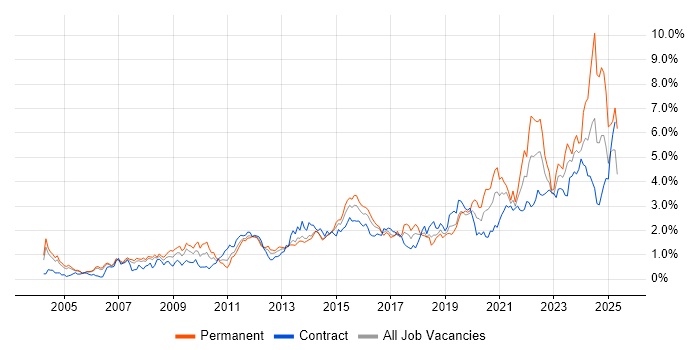
Job vacancy trend for Decision-Making in Reading

Decision-Making
Salary Trend in Reading

3-month moving average salary quoted in jobs citing Decision-Making in Reading.

Salary trend for Decision-Making in Reading

Decision-Making
Salary Histogram in Reading

Salary distribution for jobs citing Decision-Making in Reading over the 6 months to 27 May 2024.

Salary histogram for Decision-Making in Reading

Decision-Making
Co-occurring Skills and Capabilities in Reading by Category

The follow tables expand on the table above by listing co-occurrences grouped by category. The same employment type, locality and period is covered with up to 20 co-occurrences shown in each of the following categories:

Applications
1 5 (5.26%) Microsoft Excel
1 5 (5.26%) Microsoft Project
2 3 (3.16%) Siemens NX
3 2 (2.11%) Microsoft PowerPoint
4 1 (1.05%) Microsoft Office
Business Applications
1 3 (3.16%) Teamcenter
2 2 (2.11%) SAP S/4HANA
3 1 (1.05%) Primavera
3 1 (1.05%) SAP IBP
Cloud Services
1 5 (5.26%) Microsoft 365
2 4 (4.21%) Azure
3 1 (1.05%) AWS
3 1 (1.05%) Dynamics 365
3 1 (1.05%) SaaS
Communications & Networking
1 1 (1.05%) Firewall
1 1 (1.05%) Intrusion Detection
1 1 (1.05%) tcpdump
1 1 (1.05%) Wireshark
Database & Business Intelligence
1 5 (5.26%) Relational Database
2 1 (1.05%) Hadoop
2 1 (1.05%) MS Access
2 1 (1.05%) Oracle Database
General
1 37 (38.95%) Social Skills
2 21 (22.11%) Analytical Skills
3 9 (9.47%) Finance
4 8 (8.42%) Organisational Skills
5 7 (7.37%) Influencing Skills
5 7 (7.37%) Legal
5 7 (7.37%) Marketing
6 5 (5.26%) Public Sector
7 3 (3.16%) Manufacturing
8 2 (2.11%) Billing
8 2 (2.11%) Police
9 1 (1.05%) Presentation Skills
9 1 (1.05%) Publishing
9 1 (1.05%) Retail
9 1 (1.05%) Telecoms
Job Titles
1 38 (40.00%) Senior
2 21 (22.11%) Systems Engineer
3 20 (21.05%) Senior Systems Engineer
4 14 (14.74%) Infrastructure Engineer
4 14 (14.74%) Senior Infrastructure Engineer
5 13 (13.68%) Configuration Manager
6 9 (9.47%) Administrator
6 9 (9.47%) Systems Administrator
7 8 (8.42%) Senior Systems Administrator
8 7 (7.37%) Analyst
8 7 (7.37%) Senior Manager
9 6 (6.32%) Head of Compliance
9 6 (6.32%) Head of Information
9 6 (6.32%) Head of Information Assurance
9 6 (6.32%) Sales Executive
10 5 (5.26%) Consultant
10 5 (5.26%) Principal Consultant
10 5 (5.26%) Principal Technical Consultant
10 5 (5.26%) Project Manager
10 5 (5.26%) Technical Consultant
Libraries, Frameworks & Software Standards
1 1 (1.05%) EDI
Miscellaneous
1 26 (27.37%) Management Information System
2 7 (7.37%) Legacy Systems
3 6 (6.32%) Cyber Defence
4 4 (4.21%) Insider Threat
4 4 (4.21%) Security Operations Centre
5 3 (3.16%) Data Centre
5 3 (3.16%) Enterprise Software
6 2 (2.11%) IoT
6 2 (2.11%) Robotics
6 2 (2.11%) Self-Motivation
7 1 (1.05%) Analytical Mindset
7 1 (1.05%) Cyber Kill Chain
7 1 (1.05%) Cyberattack
7 1 (1.05%) Hybrid Cloud
7 1 (1.05%) Onboarding
7 1 (1.05%) Social Media
Operating Systems
1 20 (21.05%) Windows
2 18 (18.95%) Windows Server 2016
2 18 (18.95%) Windows Server 2019
3 17 (17.89%) Windows 10
3 17 (17.89%) Windows 7
3 17 (17.89%) Windows Server 2012
4 3 (3.16%) Linux
5 2 (2.11%) Embedded Linux
Processes & Methodologies
1 50 (52.63%) Cybersecurity
1 50 (52.63%) Data-Driven Decision Making
2 36 (37.89%) Problem-Solving
3 25 (26.32%) ITIL
4 22 (23.16%) Change Management
5 20 (21.05%) Roadmaps
6 18 (18.95%) Problem Management
7 17 (17.89%) Project Management
8 16 (16.84%) Stakeholder Engagement
9 14 (14.74%) Infrastructure Engineering
10 13 (13.68%) Mentoring
11 12 (12.63%) Coaching
11 12 (12.63%) Continuous Improvement
11 12 (12.63%) Knowledge Management
11 12 (12.63%) Systems Engineering
11 12 (12.63%) Validation
12 11 (11.58%) Agile
12 11 (11.58%) Customer Service
13 9 (9.47%) Programme Management
13 9 (9.47%) Project Delivery
Programming Languages
1 18 (18.95%) PowerShell
2 2 (2.11%) C
2 2 (2.11%) Embedded C
2 2 (2.11%) Python
3 1 (1.05%) SQL
Qualifications
1 60 (63.16%) Security Cleared
2 36 (37.89%) Degree
3 23 (24.21%) HNC
4 10 (10.53%) SC Cleared
5 7 (7.37%) ITIL Certification
6 6 (6.32%) HND
7 4 (4.21%) PRINCE2 Practitioner
8 3 (3.16%) Azure Certification
9 1 (1.05%) DV Cleared
9 1 (1.05%) PMI Certification
9 1 (1.05%) PMP
Quality Assurance & Compliance
1 7 (7.37%) ISO/IEC 27001
1 7 (7.37%) NIST
2 6 (6.32%) GRC
2 6 (6.32%) NCSC
2 6 (6.32%) NIST 800
3 1 (1.05%) Data Quality
3 1 (1.05%) GDPR
3 1 (1.05%) ISO 9001
3 1 (1.05%) QA
3 1 (1.05%) SLA
System Software
1 17 (17.89%) Active Directory
1 17 (17.89%) VMware Infrastructure
2 1 (1.05%) Virtual Machines
Systems Management
1 17 (17.89%) SCCM
Vendors
1 27 (28.42%) Microsoft
2 17 (17.89%) VMware
3 4 (4.21%) BT
4 3 (3.16%) Cadence
4 3 (3.16%) SAP
4 3 (3.16%) Siemens
5 1 (1.05%) Cisco
5 1 (1.05%) Citrix
5 1 (1.05%) Mitel
5 1 (1.05%) NEC
5 1 (1.05%) Oracle
5 1 (1.05%) Splunk
5 1 (1.05%) Zoho