Azure Jobs in Wales

Microsoft Azure
UK > Wales

The table below provides summary statistics for permanent job vacancies advertised in Wales requiring Azure skills. It includes a benchmarking guide to the annual salaries offered in vacancies that cited Azure over the 6 months leading up to 26 July 2024, comparing them to the same period in the previous two years.

6 months to
26 Jul 2024
Same period 2023 Same period 2022
Rank 4 4 5
Rank change year-on-year 0 +1 0
Permanent jobs citing Azure 284 393 382
As % of all permanent jobs advertised in Wales 14.72% 22.98% 19.50%
As % of the Cloud Services category 54.51% 66.16% 45.91%
Number of salaries quoted 213 226 285
10th Percentile £31,400 £26,875 £36,115
25th Percentile £40,000 £37,375 £41,250
Median annual salary (50th Percentile) £50,000 £47,500 £50,000
Median % change year-on-year +5.26% -5.00% +11.11%
75th Percentile £60,000 £67,067 £60,000
90th Percentile £70,000 £73,750 £75,000
UK median annual salary £60,000 £62,500 £62,500
% change year-on-year -4.00% - +4.17%

All Cloud Skills
Wales

Azure falls under the Cloud Services category. For comparison with the information above, the following table provides summary statistics for all permanent job vacancies requiring cloud computing skills in Wales.

Permanent vacancies with a requirement for cloud computing skills 521 594 832
As % of all permanent jobs advertised in Wales 27.01% 34.74% 42.47%
Number of salaries quoted 398 365 576
10th Percentile £28,290 £26,250 £32,500
25th Percentile £37,500 £36,250 £39,700
Median annual salary (50th Percentile) £50,000 £46,750 £50,119
Median % change year-on-year +6.95% -6.72% +11.38%
75th Percentile £62,500 £65,769 £62,500
90th Percentile £71,250 £75,000 £75,000
UK median annual salary £60,000 £62,500 £62,500
% change year-on-year -4.00% - +4.17%

Azure
Job Vacancy Trend in Wales

Job postings citing Azure as a proportion of all IT jobs advertised in Wales.
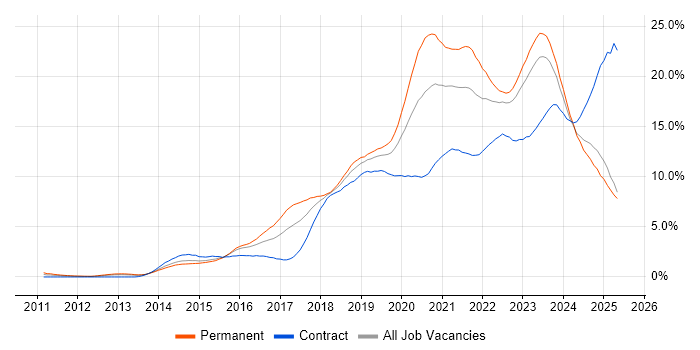
Job vacancy trend for Azure in Wales

Azure
Salary Trend in Wales

3-month moving average salary quoted in jobs citing Azure in Wales.

Salary trend for Azure in Wales

Azure
Salary Histogram in Wales

Salary distribution for jobs citing Azure in Wales over the 6 months to 26 July 2024.

Salary histogram for Azure in Wales

Azure
Job Locations in Wales

The table below looks at the demand and provides a guide to the median salaries quoted in IT jobs citing Azure within the Wales region over the 6 months to 26 July 2024. The 'Rank Change' column provides an indication of the change in demand within each location based on the same 6 month period last year.

Location Rank Change
on Same Period
Last Year
Matching
Permanent
IT Job Ads
Median Salary
Past 6 Months
Median Salary
% Change
on Same Period
Last Year
Live
Jobs
South Wales 0 219 £52,000 -5.45% 23
West Wales 0 36 £51,000 +14.07% 3
North Wales +4 23 £40,000 -11.11% 3
Mid Wales -8 3 - - 1
Dyfed 0 1 £38,000 -50.97% 2
Azure
UK

Azure
Co-occurring Skills and Capabilities in Wales by Category

The follow tables expand on the table above by listing co-occurrences grouped by category. The same employment type, locality and period is covered with up to 20 co-occurrences shown in each of the following categories:

Application Platforms
1 17 (5.99%) ArcGIS
1 17 (5.99%) GeoServer
2 13 (4.58%) Microsoft Exchange
2 13 (4.58%) SharePoint
3 6 (2.11%) Confluence
4 4 (1.41%) WebLogic
5 3 (1.06%) Jupyter
6 2 (0.70%) Apache
6 2 (0.70%) Apache Spark
6 2 (0.70%) IIS
6 2 (0.70%) WebSphere
7 1 (0.35%) CMS
7 1 (0.35%) Umbraco
Applications
1 7 (2.46%) Microsoft Excel
1 7 (2.46%) Microsoft Office
1 7 (2.46%) Microsoft PowerPoint
2 1 (0.35%) Microsoft Project
Business Applications
1 7 (2.46%) Oracle EBS
2 4 (1.41%) Sparx Enterprise Architect
3 3 (1.06%) Dynamics CRM
4 1 (0.35%) Dynamics AX
Cloud Services
1 102 (35.92%) AWS
2 59 (20.77%) Microsoft 365
3 35 (12.32%) Azure DevOps
4 28 (9.86%) Power Platform
5 27 (9.51%) GCP
6 25 (8.80%) Entra ID
7 21 (7.39%) SaaS
8 8 (2.82%) OCI
9 7 (2.46%) OneDrive
10 6 (2.11%) Dynamics 365
11 5 (1.76%) Azure Service Bus
11 5 (1.76%) dbt
12 4 (1.41%) Amazon EKS
12 4 (1.41%) Amazon SQS
12 4 (1.41%) Azure API Management
12 4 (1.41%) Cloud Computing
12 4 (1.41%) GitHub
13 3 (1.06%) iPaaS
13 3 (1.06%) PaaS
13 3 (1.06%) PowerApps
Communications & Networking
1 27 (9.51%) Firewall
2 20 (7.04%) DNS
3 10 (3.52%) DHCP
3 10 (3.52%) TCP/IP
3 10 (3.52%) WAN
4 9 (3.17%) Internet
5 8 (2.82%) LAN
5 8 (2.82%) Network Security
6 6 (2.11%) BGP
6 6 (2.11%) MPLS
6 6 (2.11%) Remote Desktop
6 6 (2.11%) Wi-Fi
6 6 (2.11%) Wireless
7 5 (1.76%) SAN
7 5 (1.76%) VPN
8 4 (1.41%) SSL
9 3 (1.06%) Extranet
9 3 (1.06%) SD-WAN
9 3 (1.06%) Unified Communications
10 2 (0.70%) EIGRP
Database & Business Intelligence
1 44 (15.49%) SQL Server
2 28 (9.86%) PostgreSQL
3 19 (6.69%) Data Warehouse
3 19 (6.69%) GIS
4 17 (5.99%) QGIS
5 13 (4.58%) Power BI
6 9 (3.17%) Relational Database
7 7 (2.46%) Azure SQL Data Warehouse
7 7 (2.46%) Geospatial Data
7 7 (2.46%) RDBMS
8 6 (2.11%) MongoDB
9 5 (1.76%) Big Data
9 5 (1.76%) Data Lake
10 4 (1.41%) Amazon RDS
10 4 (1.41%) Oracle Database
10 4 (1.41%) Tableau
11 3 (1.06%) Azure SQL Database
11 3 (1.06%) Data Vault
11 3 (1.06%) Elasticsearch
11 3 (1.06%) Metabase
Development Applications
1 22 (7.75%) Git
2 13 (4.58%) JIRA
3 12 (4.23%) Jenkins
3 12 (4.23%) Selenium
4 6 (2.11%) GitLab
4 6 (2.11%) Visual Studio
5 4 (1.41%) JMeter
5 4 (1.41%) Postman
5 4 (1.41%) SoapUI
6 3 (1.06%) SQL Server Management Studio (SSMS)
6 3 (1.06%) Team Foundation Server
6 3 (1.06%) Visual Studio Code
6 3 (1.06%) Visual Studio Team System
7 2 (0.70%) Cypress.io
7 2 (0.70%) DBeaver
7 2 (0.70%) GitKraken
7 2 (0.70%) JetBrains Rider
7 2 (0.70%) NUnit
7 2 (0.70%) ReSharper
8 1 (0.35%) JUnit
General
1 56 (19.72%) Social Skills
2 37 (13.03%) Finance
3 21 (7.39%) Games
4 16 (5.63%) Analytical Skills
4 16 (5.63%) Presentation Skills
5 13 (4.58%) Inclusion and Diversity
6 10 (3.52%) Marketing
7 8 (2.82%) Advertising
7 8 (2.82%) Public Sector
8 7 (2.46%) Welsh Language
9 6 (2.11%) Retail
10 5 (1.76%) Law
10 5 (1.76%) Manufacturing
11 4 (1.41%) Banking
11 4 (1.41%) Local Government
12 3 (1.06%) Legal
12 3 (1.06%) Police
13 1 (0.35%) Health Technology
13 1 (0.35%) Influencing Skills
13 1 (0.35%) Telecoms
Job Titles
1 80 (28.17%) Developer
2 49 (17.25%) Architect
3 47 (16.55%) Senior
4 35 (12.32%) Lead
5 32 (11.27%) .NET Developer
6 26 (9.15%) C# Developer
7 21 (7.39%) C# .NET Developer
8 20 (7.04%) Software Engineer
9 17 (5.99%) Technical Architect
10 15 (5.28%) DBA
10 15 (5.28%) Support Engineer
11 13 (4.58%) Software Developer
12 12 (4.23%) IT Support
12 12 (4.23%) Technical Leader
13 11 (3.87%) Administrator
13 11 (3.87%) Games Developer
13 11 (3.87%) IT Engineer
13 11 (3.87%) Senior Developer
14 10 (3.52%) Consultant
14 10 (3.52%) Solutions Architect
Libraries, Frameworks & Software Standards
1 79 (27.82%) .NET
2 56 (19.72%) React
3 38 (13.38%) CSS
4 36 (12.68%) .NET Core
5 35 (12.32%) AngularJS
6 24 (8.45%) HTML
7 20 (7.04%) ASP.NET
8 19 (6.69%) ASP.NET Web API
9 18 (6.34%) HTML5
9 18 (6.34%) RESTful
10 17 (5.99%) Leaflet
10 17 (5.99%) OpenLayers
10 17 (5.99%) PostGIS
11 14 (4.93%) Spring Boot
11 14 (4.93%) Vue
12 13 (4.58%) Blazor
12 13 (4.58%) CSS3
13 12 (4.23%) REST
14 10 (3.52%) .NET Framework
14 10 (3.52%) Spring
Miscellaneous
1 14 (4.93%) Greenfield Project
1 14 (4.93%) Public Cloud
2 13 (4.58%) Enterprise Software
3 8 (2.82%) Data Centre
4 7 (2.46%) Cloud Native
4 7 (2.46%) Legacy Systems
4 7 (2.46%) PKI
4 7 (2.46%) Private Cloud
4 7 (2.46%) Product Ownership
5 6 (2.11%) Self-Motivation
6 4 (1.41%) Cyberattack
6 4 (1.41%) IoT
6 4 (1.41%) Replication
7 3 (1.06%) Clustering
7 3 (1.06%) Hybrid Cloud
7 3 (1.06%) Mobile App
7 3 (1.06%) Raspberry Pi
7 3 (1.06%) Security Operations Centre
7 3 (1.06%) Tandem
8 2 (0.70%) Blockchain
Operating Systems
1 57 (20.07%) Windows
2 31 (10.92%) Windows Server
3 19 (6.69%) Linux
4 7 (2.46%) Android
5 6 (2.11%) Windows Server 2012
5 6 (2.11%) Windows Server 2019
6 5 (1.76%) Apple iOS
6 5 (1.76%) Windows 10
7 4 (1.41%) Mac OS
7 4 (1.41%) Red Hat Enterprise Linux
7 4 (1.41%) Windows 7
8 3 (1.06%) VMS
9 1 (0.35%) Ubuntu
9 1 (0.35%) Unix
9 1 (0.35%) Windows Server 2008
9 1 (0.35%) Windows Server 2016
Processes & Methodologies
1 103 (36.27%) Agile
2 75 (26.41%) DevOps
3 45 (15.85%) Problem-Solving
4 44 (15.49%) Full Stack Development
5 33 (11.62%) Software Engineering
6 30 (10.56%) Actionable Insight
7 28 (9.86%) Migration
8 27 (9.51%) Scrum
9 25 (8.80%) Roadmaps
10 24 (8.45%) Test Automation
11 22 (7.75%) CI/CD
12 21 (7.39%) Mentoring
12 21 (7.39%) Web Development
13 19 (6.69%) Containerisation
14 18 (6.34%) Continuous Integration
15 17 (5.99%) Presales
15 17 (5.99%) TOGAF
16 15 (5.28%) Fintech
16 15 (5.28%) Microservices
17 14 (4.93%) Project Delivery
Programming Languages
1 78 (27.46%) C#
2 69 (24.30%) JavaScript
3 58 (20.42%) SQL
4 35 (12.32%) Python
5 30 (10.56%) TypeScript
6 21 (7.39%) Java
7 10 (3.52%) PowerShell
8 6 (2.11%) T-SQL
9 5 (1.76%) C++
10 2 (0.70%) C
10 2 (0.70%) Kusto Query Language
11 1 (0.35%) Groovy
11 1 (0.35%) PHP
Qualifications
1 40 (14.08%) Security Cleared
2 35 (12.32%) SC Cleared
3 20 (7.04%) Degree
4 15 (5.28%) Microsoft Certification
5 10 (3.52%) Azure Certification
6 9 (3.17%) AWS Certification
6 9 (3.17%) CCNA
6 9 (3.17%) Cisco Certification
7 8 (2.82%) Computer Science Degree
8 4 (1.41%) AWS Certified Solutions Architect
9 3 (1.06%) CCNP
9 3 (1.06%) MCSE
9 3 (1.06%) TOGAF Certification
10 2 (0.70%) CISSP
10 2 (0.70%) DBS Check
10 2 (0.70%) MCSA
10 2 (0.70%) PMI Certification
11 1 (0.35%) CISM
11 1 (0.35%) CISMP
11 1 (0.35%) MCITP
Quality Assurance & Compliance
1 14 (4.93%) QA
2 8 (2.82%) SLA
3 4 (1.41%) GDPR
3 4 (1.41%) ISO/IEC 27001
4 3 (1.06%) Data Quality
5 2 (0.70%) Accessibility
5 2 (0.70%) Cyber Essentials
5 2 (0.70%) WCAG
6 1 (0.35%) NIST
6 1 (0.35%) PCI DSS
6 1 (0.35%) PMO
System Software
1 39 (13.73%) Active Directory
2 21 (7.39%) Docker
3 13 (4.58%) VMware Infrastructure
4 5 (1.76%) Virtual Machines
5 3 (1.06%) Virtual Desktop
6 2 (0.70%) Hyper-V
7 1 (0.35%) VMware ESXi
7 1 (0.35%) vSphere
Systems Management
1 19 (6.69%) Microsoft Intune
2 9 (3.17%) Terraform
3 8 (2.82%) Kubernetes
4 3 (1.06%) Ansible
4 3 (1.06%) Perfmon
4 3 (1.06%) SCCM
4 3 (1.06%) SCOM
4 3 (1.06%) Single Sign-On
5 2 (0.70%) Cisco Prime
5 2 (0.70%) SmoothWall
5 2 (0.70%) WhatsUp Gold
6 1 (0.35%) Grafana
6 1 (0.35%) Progress Chef
6 1 (0.35%) Puppet
Vendors
1 97 (34.15%) Microsoft
2 24 (8.45%) Oracle
3 17 (5.99%) ESRI
4 13 (4.58%) Cisco
4 13 (4.58%) VMware
5 12 (4.23%) Google
6 8 (2.82%) SAP
7 7 (2.46%) Meraki
8 5 (1.76%) Veeam
9 4 (1.41%) Citrix
9 4 (1.41%) ServiceNow
9 4 (1.41%) Sparx
9 4 (1.41%) Xamarin
10 3 (1.06%) AppDynamics
10 3 (1.06%) Fortinet
10 3 (1.06%) HP
10 3 (1.06%) NetApp
10 3 (1.06%) Okta
10 3 (1.06%) Salesforce
11 2 (0.70%) MuleSoft