Analytical Skills Jobs in Wales

Analytical Skills
UK > Wales

The table below looks at the prevalence of the term Analytical Skills in permanent job vacancies advertised in Wales. Included is a benchmarking guide to the salaries offered in vacancies that have cited Analytical Skills over the 6 months to 28 April 2024 with a comparison to the same period over the previous 2 years.

6 months to
28 Apr 2024
Same period 2023 Same period 2022
Rank 22 20 31
Rank change year-on-year -2 +11 +11
Permanent jobs citing Analytical Skills 154 176 151
As % of all permanent jobs advertised in Wales 7.64% 10.54% 7.99%
As % of the General category 13.80% 15.74% 12.83%
Number of salaries quoted 74 99 96
10th Percentile £32,750 £22,000 £31,475
25th Percentile £40,000 £27,625 £35,000
Median annual salary (50th Percentile) £45,000 £40,000 £40,000
Median % change year-on-year +12.50% - -9.09%
75th Percentile £52,500 £47,500 £56,250
90th Percentile £55,250 £65,414 £66,625
UK median annual salary £50,000 £54,882 £55,000
% change year-on-year -8.90% -0.21% +10.00%

All General Skills
Wales

Analytical Skills is in the General Skills category. The following table is for comparison with the above and provides summary statistics for all permanent job vacancies advertised in Wales with a requirement for common skills.

Permanent vacancies with a requirement for common skills 1,116 1,118 1,177
As % of all permanent jobs advertised in Wales 55.33% 66.95% 62.28%
Number of salaries quoted 765 539 747
10th Percentile £26,250 £26,250 £31,000
25th Percentile £31,250 £32,500 £37,500
Median annual salary (50th Percentile) £43,500 £44,666 £47,500
Median % change year-on-year -2.61% -5.97% +12.09%
75th Percentile £57,500 £57,500 £62,500
90th Percentile £67,500 £72,500 £75,000
UK median annual salary £52,500 £60,000 £60,000
% change year-on-year -12.50% - +9.09%

Analytical Skills
Job Vacancy Trend in Wales

Job postings citing Analytical Skills as a proportion of all IT jobs advertised in Wales.
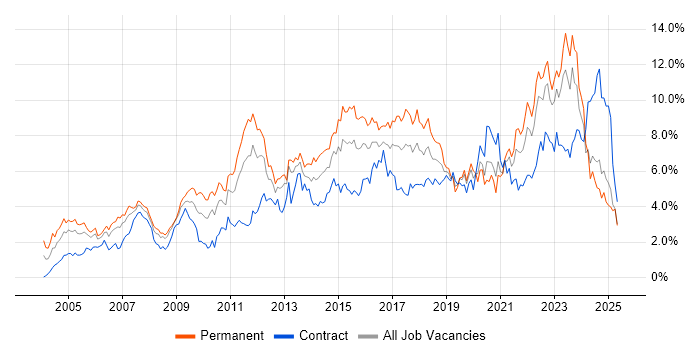
Job vacancy trend for Analytical Skills in Wales

Analytical Skills
Salary Trend in Wales

3-month moving average salary quoted in jobs citing Analytical Skills in Wales.

Salary trend for Analytical Skills in Wales

Analytical Skills
Salary Histogram in Wales

Salary distribution for jobs citing Analytical Skills in Wales over the 6 months to 28 April 2024.

Salary histogram for Analytical Skills in Wales

Analytical Skills
Job Locations in Wales

The table below looks at the demand and provides a guide to the median salaries quoted in IT jobs citing Analytical Skills within the Wales region over the 6 months to 28 April 2024. The 'Rank Change' column provides an indication of the change in demand within each location based on the same 6 month period last year.

Location Rank Change
on Same Period
Last Year
Matching
Permanent
IT Job Ads
Median Salary
Past 6 Months
Median Salary
% Change
on Same Period
Last Year
Live
Jobs
South Wales -6 111 £45,000 +12.50% 54
North Wales +6 19 £33,500 +52.27% 8
Mid Wales +4 13 £38,000 -23.23% 3
West Wales +5 10 £50,000 +17.65% 2
Analytical Skills
UK

Analytical Skills
Co-occurring Skills and Capabilities in Wales by Category

The follow tables expand on the table above by listing co-occurrences grouped by category. The same employment type, locality and period is covered with up to 20 co-occurrences shown in each of the following categories:

Application Platforms
1 37 (24.03%) WebLogic
2 30 (19.48%) Oracle Service Bus
3 9 (5.84%) SAS
4 5 (3.25%) SharePoint
5 4 (2.60%) Apache
5 4 (2.60%) Apache Spark
6 2 (1.30%) Confluence
6 2 (1.30%) Microsoft Exchange
6 2 (1.30%) Tomcat
Applications
1 41 (26.62%) Microsoft Office
2 33 (21.43%) Microsoft Excel
3 30 (19.48%) MS Visio
4 2 (1.30%) Microsoft PowerPoint
4 2 (1.30%) Microsoft Project
5 1 (0.65%) Acrobat
Business Applications
1 30 (19.48%) Remedy ITSM
2 2 (1.30%) Primavera
Cloud Services
1 10 (6.49%) Azure
2 9 (5.84%) Power Platform
3 8 (5.19%) GCP
3 8 (5.19%) WhatsApp
4 4 (2.60%) Dynamics 365
4 4 (2.60%) iPaaS
4 4 (2.60%) Microsoft 365
4 4 (2.60%) PaaS
4 4 (2.60%) Power Automate
4 4 (2.60%) PowerApps
5 3 (1.95%) AWS
6 2 (1.30%) Snowflake
7 1 (0.65%) Amazon EC2
7 1 (0.65%) Amazon S3
7 1 (0.65%) AWS CloudFormation
7 1 (0.65%) AWS Lambda
7 1 (0.65%) Entra ID
7 1 (0.65%) OneDrive
7 1 (0.65%) SaaS
7 1 (0.65%) Serverless
Communications & Networking
1 13 (8.44%) VPN
2 8 (5.19%) Ethernet
2 8 (5.19%) Profibus
3 7 (4.55%) Firewall
3 7 (4.55%) LAN
3 7 (4.55%) Network Security
3 7 (4.55%) WAN
4 5 (3.25%) MPLS
4 5 (3.25%) TCP/IP
4 5 (3.25%) VLAN
4 5 (3.25%) Wi-Fi
4 5 (3.25%) WLAN
5 4 (2.60%) SSL
6 2 (1.30%) DNS
6 2 (1.30%) FTP
6 2 (1.30%) HTTP
6 2 (1.30%) Internet
6 2 (1.30%) Intranet
6 2 (1.30%) SMTP
6 2 (1.30%) Sourcefire
Database & Business Intelligence
1 30 (19.48%) Oracle Database
1 30 (19.48%) Oracle Database 10g
1 30 (19.48%) Oracle Database 11g
1 30 (19.48%) VLDB
2 8 (5.19%) Looker
2 8 (5.19%) MySQL
3 7 (4.55%) Elasticsearch
3 7 (4.55%) SQL Server
4 6 (3.90%) BigQuery
4 6 (3.90%) PostgreSQL
4 6 (3.90%) Power BI
5 5 (3.25%) Data Warehouse
5 5 (3.25%) RDBMS
5 5 (3.25%) Relational Database
6 3 (1.95%) QlikView
6 3 (1.95%) Tableau
7 2 (1.30%) GIS
8 1 (0.65%) Amazon RDS
8 1 (0.65%) MongoDB
Development Applications
1 15 (9.74%) Git
2 4 (2.60%) Postman
2 4 (2.60%) Visual Studio
3 3 (1.95%) JIRA
4 1 (0.65%) JMeter
General
1 59 (38.31%) Social Skills
2 31 (20.13%) Finance
3 17 (11.04%) Retail
4 13 (8.44%) Legal
4 13 (8.44%) Manufacturing
5 12 (7.79%) Electronics
5 12 (7.79%) Police
6 10 (6.49%) Influencing Skills
7 9 (5.84%) Inclusion and Diversity
7 9 (5.84%) Presentation Skills
8 8 (5.19%) Welsh Language
9 7 (4.55%) Banking
9 7 (4.55%) Local Government
9 7 (4.55%) Public Sector
10 5 (3.25%) Digital Health
10 5 (3.25%) Health Technology
11 4 (2.60%) Law
11 4 (2.60%) Organisational Skills
11 4 (2.60%) Pharmaceutical
12 3 (1.95%) Games
Job Titles
1 70 (45.45%) Analyst
2 48 (31.17%) Senior
3 40 (25.97%) Support Analyst
4 38 (24.68%) Applications Support
5 37 (24.03%) Applications Support Analyst
6 30 (19.48%) Oracle Analyst
6 30 (19.48%) Oracle Support Analyst
6 30 (19.48%) SQL Analyst
6 30 (19.48%) SQL Support Analyst
7 19 (12.34%) Developer
8 17 (11.04%) Senior Analyst
9 9 (5.84%) Senior Developer
9 9 (5.84%) Software Engineer
10 8 (5.19%) Embedded Engineer
10 8 (5.19%) Senior Embedded Engineer
11 7 (4.55%) Senior Applications Support
11 7 (4.55%) Senior Applications Support Analyst
11 7 (4.55%) Senior Support Analyst
12 6 (3.90%) Business Analyst
12 6 (3.90%) Principal Engineer
Libraries, Frameworks & Software Standards
1 7 (4.55%) .NET
1 7 (4.55%) CSS
1 7 (4.55%) HTML
1 7 (4.55%) J2EE
1 7 (4.55%) Java EE
1 7 (4.55%) Spring
2 5 (3.25%) RESTful
3 4 (2.60%) .NET Framework
3 4 (2.60%) HTML5 Canvas
3 4 (2.60%) Web Services
4 3 (1.95%) Node.js
5 2 (1.30%) LDAP
5 2 (1.30%) NestJS
5 2 (1.30%) React
6 1 (0.65%) DirectX
6 1 (0.65%) HTML5
6 1 (0.65%) JSON
6 1 (0.65%) MERN Stack
6 1 (0.65%) Xamarin.iOS
6 1 (0.65%) XML
Miscellaneous
1 20 (12.99%) Self-Motivation
2 8 (5.19%) Enterprise Software
2 8 (5.19%) Housing Association
3 7 (4.55%) Analytical Mindset
4 5 (3.25%) Data Centre
4 5 (3.25%) Driving Licence
4 5 (3.25%) FMCG
4 5 (3.25%) Management Information System
4 5 (3.25%) NHS
5 4 (2.60%) ARM Cortex
5 4 (2.60%) Credit Risk
6 2 (1.30%) Cyber Threat
6 2 (1.30%) Data Structures
6 2 (1.30%) Greenfield Project
6 2 (1.30%) PKI
6 2 (1.30%) Product Ownership
6 2 (1.30%) Public Cloud
6 2 (1.30%) Security Operations Centre
7 1 (0.65%) EPoS
7 1 (0.65%) Life Science
Operating Systems
1 41 (26.62%) Unix
2 34 (22.08%) Linux
3 30 (19.48%) Solaris
4 10 (6.49%) Windows
5 4 (2.60%) FreeRTOS
5 4 (2.60%) VxWorks
6 3 (1.95%) Apple iOS
6 3 (1.95%) Mac OS
6 3 (1.95%) Windows 10
7 1 (0.65%) Android
Processes & Methodologies
1 72 (46.75%) Problem-Solving
2 42 (27.27%) Actionable Insight
3 38 (24.68%) Incident Management
4 32 (20.78%) Agile
5 31 (20.13%) Artificial Intelligence
5 31 (20.13%) Capacity Planning
5 31 (20.13%) ITSM
6 30 (19.48%) Capacity Management
6 30 (19.48%) Performance Monitoring
6 30 (19.48%) Performance Tuning
6 30 (19.48%) Release Management
7 25 (16.23%) SDLC
8 22 (14.29%) Continuous Improvement
9 18 (11.69%) Line Management
10 17 (11.04%) Customer Service
10 17 (11.04%) DevOps
11 15 (9.74%) ITIL
11 15 (9.74%) Mathematics
12 14 (9.09%) Analytical Thinking
13 12 (7.79%) Mentoring
Programming Languages
1 47 (30.52%) SQL
2 31 (20.13%) PL/SQL
3 15 (9.74%) C#
4 13 (8.44%) C
5 11 (7.14%) Java
6 9 (5.84%) JavaScript
7 7 (4.55%) Python
7 7 (4.55%) R
7 7 (4.55%) Shell Script
8 5 (3.25%) C++
9 4 (2.60%) Embedded C++
10 1 (0.65%) Groovy
10 1 (0.65%) Kusto Query Language
10 1 (0.65%) PHP
Qualifications
1 66 (42.86%) Degree
2 53 (34.42%) SC Cleared
2 53 (34.42%) Security Cleared
3 5 (3.25%) Cisco Certification
4 4 (2.60%) HND
5 2 (1.30%) ISTQB
5 2 (1.30%) Master's Degree
5 2 (1.30%) Postgraduate
6 1 (0.65%) BPSS Clearance
6 1 (0.65%) Computer Science Degree
6 1 (0.65%) ITIL Certification
6 1 (0.65%) ITIL Foundation Certificate
6 1 (0.65%) PMI Certification
6 1 (0.65%) PMP
6 1 (0.65%) Six Sigma Green Belt
Quality Assurance & Compliance
1 43 (27.92%) SLA
2 12 (7.79%) GDPR
3 8 (5.19%) 21 CFR Part 11
3 8 (5.19%) ISO 13485
4 6 (3.90%) QA
5 5 (3.25%) Data Quality
6 4 (2.60%) CRD IV
6 4 (2.60%) GLP
6 4 (2.60%) GMP
6 4 (2.60%) IFRS
6 4 (2.60%) IFRS 9
6 4 (2.60%) MISRA
7 3 (1.95%) Accessibility
8 2 (1.30%) PMO
9 1 (0.65%) Government Security Classifications
9 1 (0.65%) ISO 9000
System Software
1 30 (19.48%) Oracle RAC
2 8 (5.19%) Active Directory
2 8 (5.19%) Firmware
Systems Management
1 30 (19.48%) Data Guard
1 30 (19.48%) Oracle RMAN
2 7 (4.55%) OpenSSO
2 7 (4.55%) Single Sign-On
3 3 (1.95%) Microsoft Intune
4 2 (1.30%) FortiGate
4 2 (1.30%) Jamf Pro
4 2 (1.30%) Progress Chef
5 1 (0.65%) Grafana
5 1 (0.65%) Kubernetes
5 1 (0.65%) Terraform
Vendors
1 38 (24.68%) Oracle
2 37 (24.03%) Remedy
3 30 (19.48%) Sun
4 22 (14.29%) Microsoft
5 7 (4.55%) Cisco
6 6 (3.90%) Google
7 4 (2.60%) QNX
7 4 (2.60%) Renesas
8 2 (1.30%) ArcSight
8 2 (1.30%) Atlassian
8 2 (1.30%) CheckPoint
8 2 (1.30%) Citrix
8 2 (1.30%) F5
8 2 (1.30%) IBM
8 2 (1.30%) Juniper
8 2 (1.30%) Splunk
8 2 (1.30%) TippingPoint
8 2 (1.30%) Trend Micro
9 1 (0.65%) Adobe
9 1 (0.65%) VMware