Terraform Jobs in the West Midlands

Terraform
England > West Midlands

The table below provides summary statistics for permanent job vacancies advertised in the West Midlands requiring Terraform skills. It includes a benchmarking guide to the annual salaries offered in vacancies that cited Terraform over the 6 months leading up to 26 July 2024, comparing them to the same period in the previous two years.

6 months to
26 Jul 2024
Same period 2023 Same period 2022
Rank 105 116 81
Rank change year-on-year +11 -35 -32
Permanent jobs citing Terraform 135 112 332
As % of all permanent jobs advertised in the West Midlands 1.93% 2.21% 3.80%
As % of the Systems Management category 29.28% 22.00% 27.69%
Number of salaries quoted 109 96 127
10th Percentile £49,000 £51,250 £45,000
25th Percentile £56,250 £59,938 £51,250
Median annual salary (50th Percentile) £65,000 £70,000 £68,500
Median % change year-on-year -7.14% +2.19% -2.14%
75th Percentile £71,991 £84,688 £81,250
90th Percentile £80,000 £100,000 £85,000
England median annual salary £75,000 £75,000 £75,000
% change year-on-year - - +3.81%

All Systems Management Skills
West Midlands

Terraform falls under the Systems Management category. For comparison with the information above, the following table provides summary statistics for all permanent job vacancies requiring systems management skills in the West Midlands.

Permanent vacancies with a requirement for systems management skills 461 509 1,199
As % of all permanent jobs advertised in the West Midlands 6.59% 10.03% 13.73%
Number of salaries quoted 321 350 725
10th Percentile £27,500 £30,342 £35,344
25th Percentile £40,000 £40,688 £42,500
Median annual salary (50th Percentile) £55,000 £57,500 £55,000
Median % change year-on-year -4.35% +4.55% -4.35%
75th Percentile £68,000 £75,000 £75,000
90th Percentile £81,250 £86,250 £85,000
England median annual salary £62,783 £67,500 £70,000
% change year-on-year -6.99% -3.57% +7.69%

Terraform
Job Vacancy Trend in the West Midlands

Job postings citing Terraform as a proportion of all IT jobs advertised in the West Midlands.
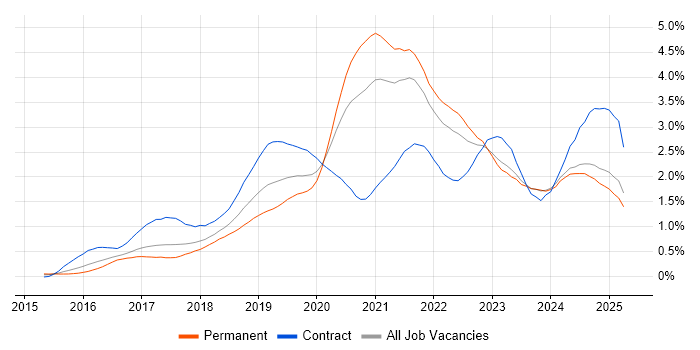
Job vacancy trend for Terraform in the West Midlands

Terraform
Salary Trend in the West Midlands

3-month moving average salary quoted in jobs citing Terraform in the West Midlands.

Salary trend for Terraform in the West Midlands

Terraform
Salary Histogram in the West Midlands

Salary distribution for jobs citing Terraform in the West Midlands over the 6 months to 26 July 2024.

Salary histogram for Terraform in the West Midlands

Terraform
Job Locations in the West Midlands

The table below looks at the demand and provides a guide to the median salaries quoted in IT jobs citing Terraform within the West Midlands region over the 6 months to 26 July 2024. The 'Rank Change' column provides an indication of the change in demand within each location based on the same 6 month period last year.

Location Rank Change
on Same Period
Last Year
Matching
Permanent
IT Job Ads
Median Salary
Past 6 Months
Median Salary
% Change
on Same Period
Last Year
Live
Jobs
Birmingham -22 51 £68,500 -5.52% 10
Warwickshire +29 23 £65,000 -25.71% 1
Staffordshire -5 20 £60,000 -14.29% 2
Coventry +23 4 £59,250 +3.04%
Solihull +8 4 £66,000 - 2
Wednesbury - 1 £64,000 -
Terraform
England

Terraform
Co-occurring Skills and Capabilities in the West Midlands by Category

The follow tables expand on the table above by listing co-occurrences grouped by category. The same employment type, locality and period is covered with up to 20 co-occurrences shown in each of the following categories:

Application Platforms
1 6 (4.44%) Apache
2 5 (3.70%) Microsoft Exchange
3 4 (2.96%) Apache Airflow
4 3 (2.22%) Apache Spark
4 3 (2.22%) IIS
Applications
1 4 (2.96%) Microsoft Office
Business Applications
1 4 (2.96%) NetSuite
1 4 (2.96%) Oracle EBS
1 4 (2.96%) Oracle ERP
1 4 (2.96%) PeopleSoft HCM
Cloud Services
1 98 (72.59%) Azure
2 59 (43.70%) AWS
3 43 (31.85%) Azure DevOps
4 40 (29.63%) GitHub
5 34 (25.19%) IaaS
5 34 (25.19%) PaaS
6 27 (20.00%) GitHub Actions
7 20 (14.81%) Microsoft 365
7 20 (14.81%) SaaS
8 16 (11.85%) Azure Data Factory
9 12 (8.89%) Power Platform
10 11 (8.15%) AWS Lambda
10 11 (8.15%) Azure Synapse Analytics
11 8 (5.93%) Entra ID
12 7 (5.19%) Amazon EC2
12 7 (5.19%) Amazon S3
12 7 (5.19%) Cloud Computing
12 7 (5.19%) Serverless
13 6 (4.44%) Azure Stack
13 6 (4.44%) GCP
Communications & Networking
1 12 (8.89%) DNS
1 12 (8.89%) Firewall
1 12 (8.89%) VPN
2 5 (3.70%) DHCP
3 4 (2.96%) IPsec
3 4 (2.96%) Network Security
4 1 (0.74%) BIG-IP
4 1 (0.74%) Cisco ASA
4 1 (0.74%) Cisco ISE
4 1 (0.74%) Cisco Nexus
4 1 (0.74%) Cisco Wireless
4 1 (0.74%) MPLS
4 1 (0.74%) NGFW
4 1 (0.74%) SAN
4 1 (0.74%) SD-WAN
4 1 (0.74%) WAN
4 1 (0.74%) Wireless
Database & Business Intelligence
1 20 (14.81%) Data Warehouse
2 17 (12.59%) MySQL
3 16 (11.85%) Relational Database
4 15 (11.11%) Data Lake
5 12 (8.89%) Power BI
6 11 (8.15%) Big Data
6 11 (8.15%) Metadata
6 11 (8.15%) SQL Server
6 11 (8.15%) SQL Server Analysis Services
6 11 (8.15%) SQL Server Integration Services
7 8 (5.93%) Microsoft Analysis Services
8 7 (5.19%) Amazon RDS
9 6 (4.44%) Amazon Redshift
10 4 (2.96%) NoSQL
10 4 (2.96%) RDBMS
11 3 (2.22%) Delta Lake
12 1 (0.74%) Amazon Aurora
12 1 (0.74%) BigQuery
12 1 (0.74%) MongoDB
12 1 (0.74%) PostgreSQL
Development Applications
1 20 (14.81%) Git
2 15 (11.11%) SonarQube
3 5 (3.70%) Visual Studio Code
4 4 (2.96%) GitLab
4 4 (2.96%) Postman
5 3 (2.22%) Octopus Deploy
6 2 (1.48%) JIRA
7 1 (0.74%) Jenkins
7 1 (0.74%) Sonatype Nexus
General
1 36 (26.67%) Finance
2 32 (23.70%) Social Skills
3 18 (13.33%) Inclusion and Diversity
4 8 (5.93%) Pharmaceutical
4 8 (5.93%) Public Sector
5 6 (4.44%) Retail
6 5 (3.70%) Legal
7 3 (2.22%) Documentation Skills
8 1 (0.74%) Analytical Skills
Job Titles
1 31 (22.96%) Senior
2 27 (20.00%) Azure Engineer
3 20 (14.81%) Cloud Engineer
4 19 (14.07%) Data Engineer
5 18 (13.33%) Developer
5 18 (13.33%) DevOps Engineer
6 12 (8.89%) Analyst
6 12 (8.89%) Citrix Analyst
7 10 (7.41%) Architect
7 10 (7.41%) Full Stack Developer
7 10 (7.41%) Lead
7 10 (7.41%) Technical Analyst
8 9 (6.67%) Azure Data Engineer
8 9 (6.67%) Cloud Technical Analyst
8 9 (6.67%) Consultant
9 7 (5.19%) Citrix Engineer
9 7 (5.19%) Identity and Access Management Engineer
9 7 (5.19%) Identity Management Engineer
9 7 (5.19%) Senior Cloud Engineer
9 7 (5.19%) Technical Engineer
Libraries, Frameworks & Software Standards
1 21 (15.56%) ARM Templates
2 15 (11.11%) Azure Blueprints
3 12 (8.89%) JSON
4 11 (8.15%) React
5 10 (7.41%) CSS
5 10 (7.41%) HTML
5 10 (7.41%) HTML5
5 10 (7.41%) Laravel
6 9 (6.67%) Node.js
7 8 (5.93%) YAML
8 7 (5.19%) Jest
9 6 (4.44%) .NET
10 5 (3.70%) ADO
10 5 (3.70%) Next.js
11 4 (2.96%) Oracle Fusion
11 4 (2.96%) Spring
11 4 (2.96%) Spring Boot
12 3 (2.22%) .NET Framework
12 3 (2.22%) PySpark
12 3 (2.22%) XML
Miscellaneous
1 19 (14.07%) Management Information System
2 18 (13.33%) Onboarding
3 9 (6.67%) Product Ownership
4 8 (5.93%) Algorithms
4 8 (5.93%) Data Protection Act
4 8 (5.93%) Hybrid Cloud
4 8 (5.93%) NHS
5 7 (5.19%) PKI
5 7 (5.19%) Public Cloud
6 6 (4.44%) Data Centre
6 6 (4.44%) Legacy Code
7 5 (3.70%) Cloud Native
8 4 (2.96%) Enterprise Software
8 4 (2.96%) Linux Command Line
9 2 (1.48%) Private Cloud
10 1 (0.74%) Greenfield Project
10 1 (0.74%) Mobile App
10 1 (0.74%) Replication
Operating Systems
1 17 (12.59%) Linux
2 16 (11.85%) Windows
2 16 (11.85%) Windows Server
3 5 (3.70%) Windows 10
4 4 (2.96%) Oracle Linux
5 2 (1.48%) Ubuntu
6 1 (0.74%) Amazon Linux
6 1 (0.74%) CentOS
6 1 (0.74%) Red Hat Enterprise Linux
6 1 (0.74%) Unix
Processes & Methodologies
1 83 (61.48%) DevOps
2 59 (43.70%) Infrastructure as Code
3 51 (37.78%) CI/CD
4 38 (28.15%) Agile
5 31 (22.96%) Mentoring
6 25 (18.52%) Software Engineering
7 24 (17.78%) ITIL
8 20 (14.81%) Problem-Solving
8 20 (14.81%) Project Management
9 19 (14.07%) Cybersecurity
10 18 (13.33%) Analytics
10 18 (13.33%) Data Engineering
11 17 (12.59%) Data Modelling
12 16 (11.85%) Containerisation
12 16 (11.85%) Continuous Delivery
12 16 (11.85%) Test Automation
13 15 (11.11%) Deployment Automation
13 15 (11.11%) Dynamic Application Security Testing
13 15 (11.11%) Roadmaps
13 15 (11.11%) Static Application Security Testing
Programming Languages
1 28 (20.74%) PowerShell
2 20 (14.81%) TypeScript
3 19 (14.07%) SQL
4 18 (13.33%) JavaScript
5 14 (10.37%) PHP
6 12 (8.89%) Bicep
7 11 (8.15%) T-SQL
8 10 (7.41%) Java
8 10 (7.41%) Python
9 7 (5.19%) Bash
10 4 (2.96%) C#
11 1 (0.74%) Dart
11 1 (0.74%) Shell Script
Qualifications
1 17 (12.59%) BPSS Clearance
2 15 (11.11%) Azure Certification
2 15 (11.11%) Degree
2 15 (11.11%) Security Cleared
3 7 (5.19%) Computer Science Degree
4 4 (2.96%) Microsoft Certification
4 4 (2.96%) Oracle Certification
5 1 (0.74%) AWS Certification
5 1 (0.74%) CCNA
5 1 (0.74%) CCNP
5 1 (0.74%) CEH
5 1 (0.74%) Cisco Certification
5 1 (0.74%) CISSP
Quality Assurance & Compliance
1 15 (11.11%) NCSC
2 12 (8.89%) Data Quality
3 11 (8.15%) GDPR
4 1 (0.74%) ISO/IEC 27001
4 1 (0.74%) NIST
System Software
1 40 (29.63%) Docker
2 17 (12.59%) Active Directory
3 13 (9.63%) VMware Infrastructure
4 12 (8.89%) XenApp
4 12 (8.89%) XenDesktop
5 8 (5.93%) Hyper-V
6 4 (2.96%) Virtual Machines
7 1 (0.74%) Virtual Desktop
7 1 (0.74%) VMware ESXi
7 1 (0.74%) vSphere
Systems Management
1 33 (24.44%) Kubernetes
2 25 (18.52%) Ansible
3 12 (8.89%) Single Sign-On
4 9 (6.67%) Microsoft Intune
5 5 (3.70%) Active Directory Federation Services
5 5 (3.70%) SCCM
6 2 (1.48%) Grafana
7 1 (0.74%) Prometheus
Vendors
1 53 (39.26%) Microsoft
2 18 (13.33%) VMware
3 13 (9.63%) Citrix
3 13 (9.63%) Databricks
4 5 (3.70%) Ivanti
4 5 (3.70%) Oracle
4 5 (3.70%) Zscaler
5 4 (2.96%) Hyperion
5 4 (2.96%) JD Edwards
5 4 (2.96%) PeopleSoft
6 3 (2.22%) SnapLogic
7 2 (1.48%) Cisco
8 1 (0.74%) CheckPoint
8 1 (0.74%) F5
8 1 (0.74%) Google
8 1 (0.74%) Informatica
8 1 (0.74%) NetApp
8 1 (0.74%) Palo Alto
8 1 (0.74%) ServiceNow
8 1 (0.74%) SolarWinds