Project Management Jobs in the West Midlands

Project Management
England > West Midlands

The table below provides summary statistics for permanent job vacancies advertised in the West Midlands requiring Project Management skills. It includes a benchmarking guide to the annual salaries offered in vacancies that cited Project Management over the 6 months leading up to 30 April 2025, comparing them to the same period in the previous two years.

6 months to
30 Apr 2025
Same period 2024 Same period 2023
Rank 15 16 18
Rank change year-on-year +1 +2 -1
Permanent jobs citing Project Management 391 625 785
As % of all permanent jobs advertised in the West Midlands 8.76% 8.63% 11.78%
As % of the Processes & Methodologies category 9.60% 10.38% 12.16%
Number of salaries quoted 196 465 323
10th Percentile £37,467 £36,100 £37,500
25th Percentile £42,500 £42,500 £45,000
Median annual salary (50th Percentile) £55,000 £55,000 £55,000
Median % change year-on-year - - +10.00%
75th Percentile £65,000 £65,000 £65,000
90th Percentile £75,000 £80,000 £73,751
England median annual salary £56,402 £52,500 £57,500
% change year-on-year +7.43% -8.70% -

All Process and Methodology Skills
West Midlands

Project Management falls under the Processes and Methodologies category. For comparison with the information above, the following table provides summary statistics for all permanent job vacancies requiring process or methodology skills in the West Midlands.

Permanent vacancies with a requirement for process or methodology skills 4,071 6,019 6,455
As % of all permanent jobs advertised in the West Midlands 91.18% 83.14% 96.85%
Number of salaries quoted 1,681 4,532 3,272
10th Percentile £29,250 £26,250 £30,510
25th Percentile £38,750 £35,700 £40,000
Median annual salary (50th Percentile) £52,500 £50,000 £53,000
Median % change year-on-year +5.00% -5.66% +6.00%
75th Percentile £67,500 £63,750 £67,500
90th Percentile £80,000 £77,500 £80,000
England median annual salary £57,500 £55,000 £62,500
% change year-on-year +4.55% -12.00% +4.17%

Project Management
Job Vacancy Trend in the West Midlands

Job postings citing Project Management as a proportion of all IT jobs advertised in the West Midlands.
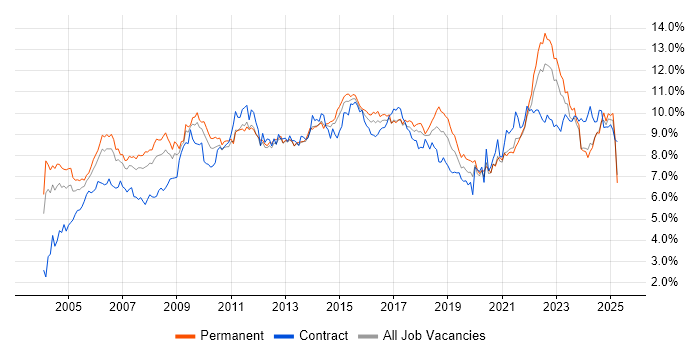
Job vacancy trend for Project Management in the West Midlands

Project Management
Salary Trend in the West Midlands

3-month moving average salary quoted in jobs citing Project Management in the West Midlands.

Salary trend for Project Management in the West Midlands

Project Management
Salary Histogram in the West Midlands

Salary distribution for jobs citing Project Management in the West Midlands over the 6 months to 30 April 2025.

Salary histogram for Project Management in the West Midlands

Project Management
Job Locations in the West Midlands

The table below looks at the demand and provides a guide to the median salaries quoted in IT jobs citing Project Management within the West Midlands region over the 6 months to 30 April 2025. The 'Rank Change' column provides an indication of the change in demand within each location based on the same 6 month period last year.

Location Rank Change
on Same Period
Last Year
Matching
Permanent
IT Job Ads
Median Salary
Past 6 Months
Median Salary
% Change
on Same Period
Last Year
Live
Jobs
Birmingham +1 165 £55,000 - 76
Warwickshire -16 84 £45,000 -10.00% 24
Staffordshire -5 34 £52,344 -0.30% 54
Coventry +12 23 £68,750 +52.78% 14
Shropshire +2 13 £42,500 -15.00% 6
Herefordshire +2 8 £40,000 +14.29% 2
Walsall +2 8 - - 1
Solihull -6 6 £55,000 +15.79% 6
Willenhall - 3 £45,000 -
Worcestershire +5 1 £55,000 +22.22% 17
Dudley -3 1 £45,000 -15.89% 2
Wolverhampton -7 1 £70,000 +30.84% 3
Project Management
England

Project Management
Co-occurring Skills and Capabilities in the West Midlands by Category

The follow tables expand on the table above by listing co-occurrences grouped by category. The same employment type, locality and period is covered with up to 20 co-occurrences shown in each of the following categories:

Application Platforms
1 22 (5.63%) SharePoint
2 9 (2.30%) Confluence
3 5 (1.28%) CMS
4 1 (0.26%) Microsoft Exchange
4 1 (0.26%) Skype for Business
Applications
1 30 (7.67%) Microsoft Excel
2 18 (4.60%) Microsoft Office
3 17 (4.35%) Microsoft Project
4 16 (4.09%) Microsoft PowerPoint
5 2 (0.51%) Simulink
6 1 (0.26%) MS Visio
6 1 (0.26%) Trello
Business Applications
1 20 (5.12%) NetSuite
2 6 (1.53%) SAP S/4HANA
3 5 (1.28%) SAP HR
4 4 (1.02%) Dynamics CRM
5 3 (0.77%) HFM
5 3 (0.77%) SAP FI
5 3 (0.77%) SAP MDG
6 2 (0.51%) Infor CloudSuite
6 2 (0.51%) Infor CloudSuite Industrial (formerly SyteLine)
6 2 (0.51%) SAP CO
6 2 (0.51%) SAP HCM
7 1 (0.26%) Dynamics NAV
7 1 (0.26%) iTrent
7 1 (0.26%) OpenText VIM for SAP
7 1 (0.26%) Oracle Payables
7 1 (0.26%) Oracle Receivables
7 1 (0.26%) SAP ERP
7 1 (0.26%) SAP MM
7 1 (0.26%) SAP PS
7 1 (0.26%) Shopify
Cloud Services
1 29 (7.42%) Azure
2 20 (5.12%) AWS
3 19 (4.86%) Microsoft 365
4 17 (4.35%) Power Platform
5 14 (3.58%) SaaS
6 12 (3.07%) Azure DevOps
7 10 (2.56%) Dynamics 365
8 9 (2.30%) GitHub
9 8 (2.05%) GitHub Actions
9 8 (2.05%) IaaS
9 8 (2.05%) PaaS
10 5 (1.28%) Boomi
10 5 (1.28%) SuccessFactors
11 4 (1.02%) GCP
11 4 (1.02%) PowerApps
12 3 (0.77%) Figma
12 3 (0.77%) Microsoft Copilot
12 3 (0.77%) Power Automate
13 2 (0.51%) Asana
14 1 (0.26%) ShareGate
Communications & Networking
1 2 (0.51%) Cisco Firepower
1 2 (0.51%) TCP/IP
1 2 (0.51%) VPN
2 1 (0.26%) DHCP
2 1 (0.26%) DNS
2 1 (0.26%) Firewall
2 1 (0.26%) SAN
2 1 (0.26%) Skype
Database & Business Intelligence
1 12 (3.07%) Power BI
2 6 (1.53%) SQL Server
3 5 (1.28%) BusinessObjects
4 4 (1.02%) DB2
4 4 (1.02%) MaxDB
4 4 (1.02%) Oracle Reports
4 4 (1.02%) SAP HANA
5 3 (0.77%) BigQuery
5 3 (0.77%) Data Warehouse
5 3 (0.77%) Essbase
5 3 (0.77%) Relational Database
6 2 (0.51%) Crystal Reports
6 2 (0.51%) NoSQL
6 2 (0.51%) Oracle Database
6 2 (0.51%) SQL Server Integration Services
6 2 (0.51%) SQL Server Reporting Services
7 1 (0.26%) Azure SQL Database
7 1 (0.26%) Big Data
7 1 (0.26%) MySQL
7 1 (0.26%) Tableau
Development Applications
1 27 (6.91%) JIRA
2 8 (2.05%) SonarQube
3 4 (1.02%) GitLab
4 3 (0.77%) Git
4 3 (0.77%) LSMW
5 2 (0.51%) Selenium
6 1 (0.26%) Bitbucket
6 1 (0.26%) Subversion
General
1 137 (35.04%) Social Skills
2 131 (33.50%) Finance
3 56 (14.32%) Analytical Skills
4 41 (10.49%) Organisational Skills
5 27 (6.91%) Public Sector
6 16 (4.09%) Legal
7 15 (3.84%) Inclusion and Diversity
8 14 (3.58%) Retail
9 12 (3.07%) Law
10 11 (2.81%) Documentation Skills
10 11 (2.81%) Police
11 10 (2.56%) Marketing
12 8 (2.05%) Banking
13 7 (1.79%) Influencing Skills
14 6 (1.53%) Automotive
14 6 (1.53%) Billing
14 6 (1.53%) Presentation Skills
15 5 (1.28%) Manufacturing
16 3 (0.77%) Advertising
16 3 (0.77%) Local Government
Job Titles
1 101 (25.83%) Principal Engineer
2 98 (25.06%) Principal Security Engineer
2 98 (25.06%) Security Engineer
3 97 (24.81%) Analyst
4 76 (19.44%) Project Manager
5 60 (15.35%) Product Analyst
6 59 (15.09%) Principal Security Analyst
6 59 (15.09%) Security Analyst
7 39 (9.97%) Consultant
7 39 (9.97%) Product Engineer
8 26 (6.65%) Senior
9 21 (5.37%) SAP Consultant
10 20 (5.12%) Lead
11 17 (4.35%) Functional Consultant
12 15 (3.84%) Senior Manager
13 14 (3.58%) NetSuite Consultant
13 14 (3.58%) Senior Project Manager
14 12 (3.07%) Business Analyst
15 10 (2.56%) Development Manager
15 10 (2.56%) IT Manager
Libraries, Frameworks & Software Standards
1 11 (2.81%) ARM Templates
2 8 (2.05%) .NET
2 8 (2.05%) Azure Blueprints
3 5 (1.28%) EDI
4 4 (1.02%) CSS
4 4 (1.02%) HTML
4 4 (1.02%) MACH
4 4 (1.02%) SAP Basis
5 3 (0.77%) MDX
5 3 (0.77%) Web Services
6 2 (0.51%) JSON
6 2 (0.51%) Playwright
6 2 (0.51%) React
6 2 (0.51%) REST
6 2 (0.51%) XML
7 1 (0.26%) CSS3
7 1 (0.26%) IDoc
7 1 (0.26%) OpenAPI
7 1 (0.26%) SAP Fiori
7 1 (0.26%) Swagger
Miscellaneous
1 26 (6.65%) Onboarding
2 15 (3.84%) Legacy Systems
3 14 (3.58%) Management Information System
4 11 (2.81%) Driving Licence
5 10 (2.56%) Self-Motivation
5 10 (2.56%) Social Media
6 6 (1.53%) Taxonomies
7 5 (1.28%) NHS
8 4 (1.02%) Data Protection Act
8 4 (1.02%) Housing Association
8 4 (1.02%) Legacy Applications
9 3 (0.77%) Data Centre
9 3 (0.77%) Data Structures
9 3 (0.77%) Mobile App
9 3 (0.77%) Replication
9 3 (0.77%) Virtual Team
10 2 (0.51%) Algorithms
10 2 (0.51%) Animation
10 2 (0.51%) PKI
10 2 (0.51%) SCADA
Operating Systems
1 15 (3.84%) Windows
2 10 (2.56%) Windows Vista
3 4 (1.02%) AIX
3 4 (1.02%) Unix
4 1 (0.26%) Android
4 1 (0.26%) Apple iOS
4 1 (0.26%) Windows Server
4 1 (0.26%) Windows Server 2003
4 1 (0.26%) Windows Server 2019
Processes & Methodologies
1 132 (33.76%) Risk Management
2 119 (30.43%) Cybersecurity
3 104 (26.60%) Information Security
4 100 (25.58%) Project Delivery
5 98 (25.06%) Cyber Resilience
5 98 (25.06%) Security Testing
6 75 (19.18%) Agile
7 67 (17.14%) Collaborative Working
8 64 (16.37%) Problem-Solving
9 59 (15.09%) Stakeholder Management
10 49 (12.53%) PRINCE2
11 46 (11.76%) Continuous Improvement
12 38 (9.72%) Change Management
13 36 (9.21%) CRM
13 36 (9.21%) ERP
14 35 (8.95%) Data Privacy
15 34 (8.70%) Mentoring
16 29 (7.42%) Analytics
16 29 (7.42%) Business Case
16 29 (7.42%) Requirements Gathering
Programming Languages
1 25 (6.39%) SQL
2 15 (3.84%) Python
3 10 (2.56%) C#
4 8 (2.05%) JavaScript
4 8 (2.05%) PowerShell
5 7 (1.79%) Java
6 6 (1.53%) ABAP
7 3 (0.77%) Groovy
8 2 (0.51%) C
8 2 (0.51%) C++
8 2 (0.51%) Embedded C
8 2 (0.51%) MATLAB
8 2 (0.51%) PHP
8 2 (0.51%) R
9 1 (0.26%) Data Analysis Expressions
9 1 (0.26%) TypeScript
Qualifications
1 149 (38.11%) Degree
2 107 (27.37%) BPSS Clearance
3 104 (26.60%) CISSP
4 102 (26.09%) CISM
5 98 (25.06%) CESG Certified Professional
6 51 (13.04%) Security Cleared
7 14 (3.58%) DBS Check
8 13 (3.32%) PMP
9 11 (2.81%) PMI Certification
10 6 (1.53%) Microsoft Certification
10 6 (1.53%) SC Cleared
11 5 (1.28%) ACCA
11 5 (1.28%) CIMA
12 4 (1.02%) AWS Certification
12 4 (1.02%) CISA
12 4 (1.02%) ISTQB
12 4 (1.02%) ISTQB Foundation Certification
12 4 (1.02%) MRICS
13 3 (0.77%) AWS Certified Solutions Architect
13 3 (0.77%) TOGAF Certification
Quality Assurance & Compliance
1 104 (26.60%) ISO/IEC 27001
2 101 (25.83%) NIST
3 98 (25.06%) JSP 440
3 98 (25.06%) RMADS
4 28 (7.16%) PMO
5 19 (4.86%) QA
6 8 (2.05%) NCSC
7 5 (1.28%) GDPR
8 4 (1.02%) Accessibility
8 4 (1.02%) Data Quality
8 4 (1.02%) NEBOSH
9 3 (0.77%) Actionable Recommendations
10 2 (0.51%) HIPAA
10 2 (0.51%) ISO/IEC 19770
10 2 (0.51%) P3O
11 1 (0.26%) GRC
11 1 (0.26%) ISO 9001
11 1 (0.26%) PMBOK
11 1 (0.26%) SLA
System Software
1 9 (2.30%) Docker
2 2 (0.51%) Active Directory
2 2 (0.51%) VMware Infrastructure
3 1 (0.26%) Firmware
3 1 (0.26%) Hyper-V
Systems Management
1 12 (3.07%) Terraform
2 10 (2.56%) Ansible
2 10 (2.56%) Kubernetes
3 2 (0.51%) ZABBIX
4 1 (0.26%) SCCM
4 1 (0.26%) SCOM
4 1 (0.26%) SCOrch
4 1 (0.26%) SCSM
Vendors
1 50 (12.79%) Microsoft
2 40 (10.23%) SAP
3 13 (3.32%) Salesforce
4 12 (3.07%) NEC
5 10 (2.56%) Oracle
5 10 (2.56%) ServiceNow
6 5 (1.28%) Alteryx
6 5 (1.28%) Dell
6 5 (1.28%) YouTube
7 4 (1.02%) VMware
8 3 (0.77%) Cisco
8 3 (0.77%) Veeam
9 2 (0.51%) Concur
9 2 (0.51%) F5
9 2 (0.51%) Google
9 2 (0.51%) Infor
9 2 (0.51%) Juniper
9 2 (0.51%) Snow
9 2 (0.51%) SolarWinds
10 1 (0.26%) Ariba