DevOps Jobs in the West Midlands

DevOps
England > West Midlands

The table below provides summary statistics for permanent job vacancies advertised in the West Midlands requiring DevOps skills. It includes a benchmarking guide to the annual salaries offered in vacancies that cited DevOps over the 6 months leading up to 9 October 2024, comparing them to the same period in the previous two years.

6 months to
9 Oct 2024
Same period 2023 Same period 2022
Rank 33 17 17
Rank change year-on-year -16 0 -6
Permanent jobs citing DevOps 317 344 921
As % of all permanent jobs advertised in the West Midlands 5.56% 9.45% 11.24%
As % of the Processes & Methodologies category 6.81% 10.11% 11.61%
Number of salaries quoted 200 305 530
10th Percentile £42,500 £36,500 £38,063
25th Percentile £51,250 £47,500 £47,500
Median annual salary (50th Percentile) £60,000 £60,000 £61,450
Median % change year-on-year - -2.36% -1.68%
75th Percentile £75,000 £71,250 £76,000
90th Percentile £83,875 £81,250 £86,250
England median annual salary £70,000 £70,000 £70,000
% change year-on-year - - +3.70%

All Process and Methodology Skills
West Midlands

DevOps falls under the Processes and Methodologies category. For comparison with the information above, the following table provides summary statistics for all permanent job vacancies requiring process or methodology skills in the West Midlands.

Permanent vacancies with a requirement for process or methodology skills 4,653 3,402 7,936
As % of all permanent jobs advertised in the West Midlands 81.62% 93.49% 96.89%
Number of salaries quoted 2,221 2,657 4,804
10th Percentile £30,750 £26,500 £31,250
25th Percentile £38,750 £37,000 £40,000
Median annual salary (50th Percentile) £55,000 £50,000 £50,000
Median % change year-on-year +10.00% - -
75th Percentile £68,000 £65,000 £66,250
90th Percentile £80,000 £78,750 £80,175
England median annual salary £60,000 £60,800 £60,000
% change year-on-year -1.32% +1.33% +4.35%

DevOps
Job Vacancy Trend in the West Midlands

Job postings citing DevOps as a proportion of all IT jobs advertised in the West Midlands.
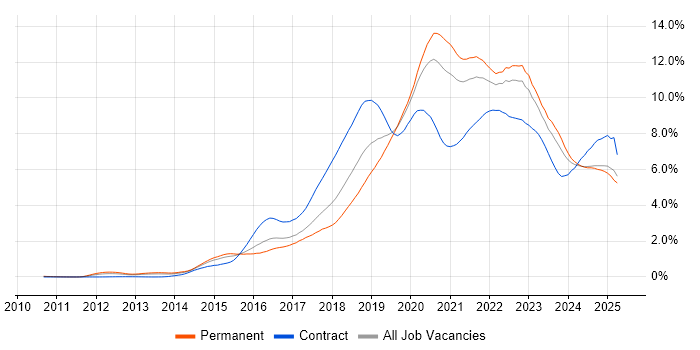
Job vacancy trend for DevOps in the West Midlands

DevOps
Salary Trend in the West Midlands

3-month moving average salary quoted in jobs citing DevOps in the West Midlands.

Salary trend for DevOps in the West Midlands

DevOps
Salary Histogram in the West Midlands

Salary distribution for jobs citing DevOps in the West Midlands over the 6 months to 9 October 2024.

Salary histogram for DevOps in the West Midlands

DevOps
Job Locations in the West Midlands

The table below looks at the demand and provides a guide to the median salaries quoted in IT jobs citing DevOps within the West Midlands region over the 6 months to 9 October 2024. The 'Rank Change' column provides an indication of the change in demand within each location based on the same 6 month period last year.

Location Rank Change
on Same Period
Last Year
Matching
Permanent
IT Job Ads
Median Salary
Past 6 Months
Median Salary
% Change
on Same Period
Last Year
Live
Jobs
Birmingham -11 137 £65,000 +6.12% 48
Warwickshire -22 42 £52,000 -5.45% 8
Staffordshire -24 33 £57,500 +17.35% 9
Solihull +6 25 £75,000 +36.36% 4
Worcestershire -5 22 £65,000 +22.07% 13
Coventry +2 18 £70,000 +17.65% 1
Shropshire -16 5 £65,000 -7.14% 2
Herefordshire -3 3 - - 3
Wolverhampton -4 3 £45,000 -10.00%
Walsall - 1 £42,500 -
DevOps
England

DevOps
Co-occurring Skills and Capabilities in the West Midlands by Category

The follow tables expand on the table above by listing co-occurrences grouped by category. The same employment type, locality and period is covered with up to 20 co-occurrences shown in each of the following categories:

Application Platforms
1 11 (3.47%) SharePoint
2 9 (2.84%) Confluence
3 7 (2.21%) IIS
3 7 (2.21%) Umbraco
4 5 (1.58%) Microsoft Exchange
5 2 (0.63%) Apache
5 2 (0.63%) Apache Airflow
5 2 (0.63%) Apache Spark
6 1 (0.32%) CMS
6 1 (0.32%) Drupal
Applications
1 7 (2.21%) Microsoft Office
2 6 (1.89%) Adobe XD
Business Applications
1 8 (2.52%) Dynamics CRM
2 2 (0.63%) Magento
2 2 (0.63%) TIBCO iProcess
2 2 (0.63%) Unit4 Business World
3 1 (0.32%) SAP S/4HANA
3 1 (0.32%) TRIRIGA
Cloud Services
1 218 (68.77%) Azure
2 160 (50.47%) Azure DevOps
3 95 (29.97%) AWS
4 59 (18.61%) Power Platform
5 41 (12.93%) PaaS
6 39 (12.30%) PowerApps
7 38 (11.99%) Power Automate
8 29 (9.15%) IaaS
9 28 (8.83%) GitHub
9 28 (8.83%) SaaS
10 23 (7.26%) GitHub Actions
11 21 (6.62%) Serverless
12 19 (5.99%) Microsoft 365
13 17 (5.36%) Azure Data Factory
13 17 (5.36%) GCP
14 16 (5.05%) Dynamics 365
15 11 (3.47%) Azure Logic Apps
16 9 (2.84%) Azure Synapse Analytics
17 6 (1.89%) Amazon EKS
17 6 (1.89%) Figma
Communications & Networking
1 16 (5.05%) Firewall
2 9 (2.84%) DNS
3 5 (1.58%) SSL
3 5 (1.58%) VPN
4 4 (1.26%) DHCP
4 4 (1.26%) Network Security
5 3 (0.95%) MQTT
6 2 (0.63%) HTTP
7 1 (0.32%) BGP
7 1 (0.32%) EIGRP
7 1 (0.32%) F5 BIG-IP LTM
7 1 (0.32%) HTTPS
7 1 (0.32%) Internet
7 1 (0.32%) OpenLDAP
7 1 (0.32%) OSPF
7 1 (0.32%) Reverse Proxy
7 1 (0.32%) SAN
7 1 (0.32%) TCP/IP
7 1 (0.32%) VLAN
Database & Business Intelligence
1 68 (21.45%) SQL Server
2 37 (11.67%) Power BI
3 13 (4.10%) Data Warehouse
3 13 (4.10%) MySQL
4 11 (3.47%) BusinessObjects
4 11 (3.47%) Relational Database
4 11 (3.47%) SQL Server Integration Services
5 10 (3.15%) Big Data
5 10 (3.15%) Data Lake
5 10 (3.15%) Metadata
6 9 (2.84%) PostgreSQL
7 8 (2.52%) Redis
7 8 (2.52%) SQL Server Analysis Services
8 5 (1.58%) Microsoft Analysis Services
9 4 (1.26%) Amazon RDS
9 4 (1.26%) NoSQL
10 3 (0.95%) Elasticsearch
10 3 (0.95%) Metadata Repository
10 3 (0.95%) OLAP
10 3 (0.95%) Oracle OLAP
Development Applications
1 33 (10.41%) Jenkins
2 31 (9.78%) Git
3 25 (7.89%) GitLab
4 23 (7.26%) SonarQube
4 23 (7.26%) Visual Studio
5 12 (3.79%) Selenium
6 11 (3.47%) JIRA
7 8 (2.52%) Team Foundation Server
7 8 (2.52%) TeamCity
8 6 (1.89%) Cucumber
8 6 (1.89%) SpecFlow
9 5 (1.58%) Visual Studio Code
9 5 (1.58%) Visual Studio Team System
10 4 (1.26%) Bitbucket
10 4 (1.26%) Maven
10 4 (1.26%) Postman
11 3 (0.95%) Chocolatey
11 3 (0.95%) WebDriver
12 2 (0.63%) Gatling
12 2 (0.63%) REST Assured
General
1 70 (22.08%) Social Skills
2 31 (9.78%) Public Sector
3 24 (7.57%) Finance
3 24 (7.57%) Inclusion and Diversity
4 17 (5.36%) Analytical Skills
5 11 (3.47%) Manufacturing
6 9 (2.84%) Retail
7 7 (2.21%) Automotive
7 7 (2.21%) Marketing
8 6 (1.89%) Pharmaceutical
9 5 (1.58%) Law
9 5 (1.58%) Police
10 4 (1.26%) Documentation Skills
11 3 (0.95%) Tech for Good
12 2 (0.63%) Legal
12 2 (0.63%) Organisational Skills
12 2 (0.63%) Presentation Skills
13 1 (0.32%) Influencing Skills
13 1 (0.32%) Telecoms
Job Titles
1 84 (26.50%) Developer
1 84 (26.50%) Senior
2 38 (11.99%) DevOps Engineer
3 37 (11.67%) Senior Developer
4 34 (10.73%) Lead
5 32 (10.09%) Architect
6 24 (7.57%) Cloud Engineer
7 20 (6.31%) Software Engineer
8 18 (5.68%) Power Platform Developer
9 17 (5.36%) .NET Developer
10 16 (5.05%) Azure Engineer
11 13 (4.10%) Data Engineer
12 12 (3.79%) Analyst
12 12 (3.79%) Senior .NET Developer
12 12 (3.79%) Senior DevOps
12 12 (3.79%) Test Leader
13 10 (3.15%) Backend Developer
13 10 (3.15%) Senior Backend Developer
13 10 (3.15%) Senior Software Engineer
14 9 (2.84%) Technical Architect
Libraries, Frameworks & Software Standards
1 89 (28.08%) .NET
2 38 (11.99%) React
3 27 (8.52%) .NET Framework
4 26 (8.20%) .NET Core
4 26 (8.20%) HTML
5 25 (7.89%) CSS
6 24 (7.57%) Entity Framework
7 21 (6.62%) ASP.NET
8 20 (6.31%) XML
9 19 (5.99%) Node.js
9 19 (5.99%) REST
10 18 (5.68%) JSON
11 17 (5.36%) ARM Templates
11 17 (5.36%) Django
12 16 (5.05%) ASP.NET Web API
12 16 (5.05%) Azure Blueprints
12 16 (5.05%) RESTful
13 14 (4.42%) AngularJS
14 13 (4.10%) XSLT
15 12 (3.79%) OAuth
Miscellaneous
1 25 (7.89%) Onboarding
2 17 (5.36%) Management Information System
3 14 (4.42%) Product Ownership
4 11 (3.47%) Public Cloud
4 11 (3.47%) Self-Motivation
5 10 (3.15%) Cloud Native
5 10 (3.15%) Greenfield Project
6 8 (2.52%) Data Structures
6 8 (2.52%) Enterprise Software
7 7 (2.21%) Legacy Systems
8 6 (1.89%) Foreign Exchange (FX)
9 5 (1.58%) Algorithms
9 5 (1.58%) Data Protection Act
9 5 (1.58%) NHS
10 4 (1.26%) Enterprise Cloud
10 4 (1.26%) PMI
10 4 (1.26%) Robotics
10 4 (1.26%) Security Posture
11 3 (0.95%) Data Centre
11 3 (0.95%) Mobile App
Operating Systems
1 29 (9.15%) Windows
2 21 (6.62%) Linux
3 8 (2.52%) Windows Server
4 7 (2.21%) VMS
5 3 (0.95%) Android
5 3 (0.95%) Apple iOS
6 2 (0.63%) CentOS
6 2 (0.63%) Ubuntu
6 2 (0.63%) Unix
7 1 (0.32%) Debian
7 1 (0.32%) Red Hat Enterprise Linux
Processes & Methodologies
1 123 (38.80%) Agile
2 117 (36.91%) CI/CD
3 65 (20.50%) Mentoring
4 64 (20.19%) Software Engineering
5 61 (19.24%) Problem-Solving
6 57 (17.98%) Infrastructure as Code
7 49 (15.46%) Test Automation
8 45 (14.20%) Continuous Integration
9 44 (13.88%) Containerisation
10 39 (12.30%) Continuous Improvement
11 31 (9.78%) Business Intelligence
12 28 (8.83%) Cloud Security
12 28 (8.83%) Continuous Delivery
13 27 (8.52%) DevSecOps
14 26 (8.20%) Full-Stack Development
14 26 (8.20%) Project Management
15 25 (7.89%) Microservices
16 24 (7.57%) Scrum
17 23 (7.26%) Cybersecurity
17 23 (7.26%) Deployment Automation
Programming Languages
1 84 (26.50%) C#
2 77 (24.29%) SQL
3 61 (19.24%) Python
4 57 (17.98%) JavaScript
5 35 (11.04%) TypeScript
6 26 (8.20%) PowerShell
7 25 (7.89%) T-SQL
8 20 (6.31%) Java
9 17 (5.36%) C++
10 14 (4.42%) Bash
10 14 (4.42%) PHP
11 10 (3.15%) VB
12 7 (2.21%) VB.NET
13 5 (1.58%) Go
14 4 (1.26%) Shell Script
15 2 (0.63%) VB6
16 1 (0.32%) Bicep
16 1 (0.32%) Ruby
16 1 (0.32%) SOQL
Qualifications
1 59 (18.61%) Security Cleared
2 30 (9.46%) SC Cleared
3 27 (8.52%) BPSS Clearance
4 20 (6.31%) Degree
5 16 (5.05%) Azure Certification
5 16 (5.05%) Microsoft Certification
6 11 (3.47%) DV Cleared
7 6 (1.89%) TOGAF Certification
8 4 (1.26%) AWS Certification
8 4 (1.26%) PMI Certification
8 4 (1.26%) SAP Certification
9 3 (0.95%) Computer Science Degree
10 2 (0.63%) ISTQB
10 2 (0.63%) ITIL Certification
11 1 (0.32%) AWS Certified Solutions Architect
11 1 (0.32%) CBAP
11 1 (0.32%) CEH
11 1 (0.32%) CISSP
11 1 (0.32%) IIBA
11 1 (0.32%) VMware Certified Professional (VCP)
Quality Assurance & Compliance
1 19 (5.99%) QA
2 17 (5.36%) NCSC
3 13 (4.10%) Accessibility
4 12 (3.79%) Data Quality
5 8 (2.52%) GDPR
6 4 (1.26%) ISO/IEC 27001
6 4 (1.26%) NIST
7 1 (0.32%) Cyber Essentials
System Software
1 59 (18.61%) Docker
2 9 (2.84%) Active Directory
3 4 (1.26%) Firmware
3 4 (1.26%) VMware Infrastructure
4 2 (0.63%) Hyper-V
4 2 (0.63%) Virtual Machines
5 1 (0.32%) vSphere
Systems Management
1 83 (26.18%) Terraform
2 68 (21.45%) Kubernetes
3 35 (11.04%) Ansible
4 11 (3.47%) Grafana
4 11 (3.47%) Prometheus
5 8 (2.52%) Puppet
5 8 (2.52%) Single Sign-On
6 7 (2.21%) Progress Chef
7 4 (1.26%) Active Directory Federation Services
8 3 (0.95%) Kustomize
9 1 (0.32%) Nessus
Vendors
1 110 (34.70%) Microsoft
2 18 (5.68%) Oracle
3 13 (4.10%) Databricks
4 11 (3.47%) SAP
5 8 (2.52%) Adobe
6 7 (2.21%) Salesforce
7 6 (1.89%) Google
7 6 (1.89%) Siemens
7 6 (1.89%) VMware
8 5 (1.58%) Atlassian
8 5 (1.58%) Palo Alto
9 4 (1.26%) Blue Prism
9 4 (1.26%) Informatica
10 3 (0.95%) ForgeRock
10 3 (0.95%) Zscaler
11 2 (0.63%) dotdigital
11 2 (0.63%) Dynatrace
11 2 (0.63%) MuleSoft
11 2 (0.63%) PagerDuty
11 2 (0.63%) ServiceNow