Analytical Skills Jobs in the West Midlands

Analytical Skills
England > West Midlands

The table below looks at the prevalence of the term Analytical Skills in permanent job vacancies in the West Midlands. Included is a benchmarking guide to the salaries offered in vacancies that cited Analytical Skills over the 6 months leading up to 12 July 2025, comparing them to the same period in the previous two years.

6 months to
12 Jul 2025
Same period 2024 Same period 2023
Rank 19 11 10
Rank change year-on-year -8 -1 +4
Permanent jobs citing Analytical Skills 334 826 678
As % of all permanent jobs advertised in the West Midlands 8.03% 10.23% 12.69%
As % of the General category 13.61% 18.11% 17.16%
Number of salaries quoted 184 413 395
10th Percentile £27,750 £24,500 £30,500
25th Percentile £33,438 £27,500 £36,500
Median annual salary (50th Percentile) £47,500 £43,806 £50,000
Median % change year-on-year +8.43% -12.39% +5.26%
75th Percentile £61,250 £58,750 £63,500
90th Percentile £75,000 £70,000 £71,250
England median annual salary £55,000 £50,000 £54,882
% change year-on-year +10.00% -8.90% -0.21%

All General Skills
West Midlands

Analytical Skills falls under the General Skills category. For comparison with the information above, the following table provides summary statistics for all permanent job vacancies requiring common skills in the West Midlands.

Permanent vacancies with a requirement for common skills 2,454 4,560 3,950
As % of all permanent jobs advertised in the West Midlands 59.03% 56.46% 73.91%
Number of salaries quoted 1,208 2,818 2,293
10th Percentile £27,500 £25,750 £30,000
25th Percentile £32,656 £32,500 £37,500
Median annual salary (50th Percentile) £50,500 £47,500 £52,500
Median % change year-on-year +6.32% -9.52% +10.53%
75th Percentile £67,500 £62,500 £67,500
90th Percentile £77,500 £75,000 £77,500
England median annual salary £55,000 £52,500 £60,000
% change year-on-year +4.76% -12.50% -

Analytical Skills
Job Vacancy Trend in the West Midlands

Job postings citing Analytical Skills as a proportion of all IT jobs advertised in the West Midlands.
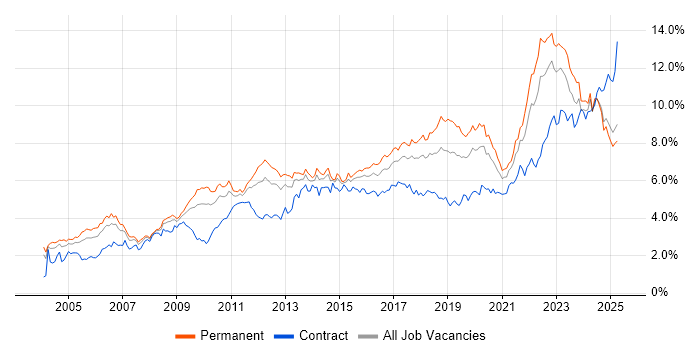
Job vacancy trend for Analytical Skills in the West Midlands

Analytical Skills
Salary Trend in the West Midlands

3-month moving average salary quoted in jobs citing Analytical Skills in the West Midlands.

Salary trend for Analytical Skills in the West Midlands

Analytical Skills
Salary Histogram in the West Midlands

Salary distribution for jobs citing Analytical Skills in the West Midlands over the 6 months to 12 July 2025.

Salary histogram for Analytical Skills in the West Midlands

Analytical Skills
Job Locations in the West Midlands

The table below looks at the demand and provides a guide to the median salaries quoted in IT jobs citing Analytical Skills within the West Midlands region over the 6 months to 12 July 2025. The 'Rank Change' column provides an indication of the change in demand within each location based on the same 6 month period last year.

Location Rank Change
on Same Period
Last Year
Matching
Permanent
IT Job Ads
Median Salary
Past 6 Months
Median Salary
% Change
on Same Period
Last Year
Live
Jobs
Birmingham +6 158 £50,000 - 139
Staffordshire -14 53 £47,500 +66.67% 115
Solihull +6 26 £55,000 +10.00% 6
Warwickshire -42 20 £30,000 -38.89% 79
Shropshire -3 18 £37,500 +15.38% 27
Coventry -14 9 £45,000 -2.17% 40
Herefordshire 0 8 £53,750 +95.45% 3
Walsall +1 4 £44,000 -7.37% 7
West Bromwich -2 4 £30,000 -
Wednesbury +10 3 £45,000 - 1
Halesowen +7 3 £36,000 -28.00%
Willenhall +1 3 £45,000 - 1
Worcestershire -13 3 £72,500 +163.64% 15
Dudley +3 2 £57,500 - 6
Analytical Skills
England

Analytical Skills
Co-occurring Skills and Capabilities in the West Midlands by Category

The follow tables expand on the table above by listing co-occurrences grouped by category. The same employment type, locality and period is covered with up to 20 co-occurrences shown in each of the following categories:

Application Platforms
1 9 (2.69%) SharePoint
2 3 (0.90%) CMS
2 3 (0.90%) Microsoft Exchange
3 2 (0.60%) IBM Notes
3 2 (0.60%) Skype for Business
4 1 (0.30%) IIS
Applications
1 34 (10.18%) Chatbot
2 23 (6.89%) Microsoft Excel
3 20 (5.99%) Microsoft Office
4 4 (1.20%) MS Visio
5 3 (0.90%) Spreadsheet
6 2 (0.60%) Adobe Captivate
6 2 (0.60%) Microsoft PowerPoint
Business Applications
1 15 (4.49%) NetSuite
2 12 (3.59%) Dynamics NAV
3 11 (3.29%) SAP S/4HANA
4 7 (2.10%) SAP ERP
5 5 (1.50%) Dynamics CRM
6 4 (1.20%) Oracle EBS
7 2 (0.60%) iTrent
7 2 (0.60%) Magento
7 2 (0.60%) Oracle Applications
7 2 (0.60%) SAP CO
7 2 (0.60%) SAP FI
7 2 (0.60%) SAP FI/CO
7 2 (0.60%) Shopify
8 1 (0.30%) Oracle SCM
8 1 (0.30%) SAP BPC
8 1 (0.30%) SAP HCM
8 1 (0.30%) SAP Payroll
Cloud Services
1 50 (14.97%) Azure
2 33 (9.88%) Power Platform
3 32 (9.58%) AWS
4 18 (5.39%) GCP
5 13 (3.89%) Microsoft 365
6 12 (3.59%) Azure Synapse Analytics
6 12 (3.59%) Snowflake
7 11 (3.29%) SaaS
8 10 (2.99%) Dynamics 365
9 9 (2.69%) Serverless
10 7 (2.10%) Google Analytics
11 6 (1.80%) Entra ID
12 5 (1.50%) Azure Data Factory
12 5 (1.50%) PowerApps
13 4 (1.20%) Azure DevOps
13 4 (1.20%) Cloud Functions
13 4 (1.20%) Google App Engine
13 4 (1.20%) Google Compute Engine
14 3 (0.90%) Cloud Computing
14 3 (0.90%) Power Automate
Communications & Networking
1 11 (3.29%) TCP/IP
2 10 (2.99%) DHCP
2 10 (2.99%) Firewall
2 10 (2.99%) LAN
2 10 (2.99%) WAN
3 8 (2.40%) VPN
4 5 (1.50%) Intrusion Detection
4 5 (1.50%) Network Security
5 4 (1.20%) BGP
5 4 (1.20%) DNS
5 4 (1.20%) HTTP
5 4 (1.20%) IPsec
5 4 (1.20%) MPLS
5 4 (1.20%) SAN
6 3 (0.90%) Cisco IOS
6 3 (0.90%) Junos
7 2 (0.60%) Broadband
7 2 (0.60%) Skype
7 2 (0.60%) SMS
7 2 (0.60%) VLAN
Database & Business Intelligence
1 29 (8.68%) Power BI
2 13 (3.89%) NoSQL
3 11 (3.29%) SQL Server
4 10 (2.99%) BigQuery
5 9 (2.69%) Tableau
6 8 (2.40%) Data Warehouse
7 7 (2.10%) Metadata
8 6 (1.80%) Amazon Redshift
8 6 (1.80%) Looker
8 6 (1.80%) PostgreSQL
9 5 (1.50%) Relational Database
10 4 (1.20%) BusinessObjects
10 4 (1.20%) Cloud Spanner
11 3 (0.90%) Elasticsearch
11 3 (0.90%) MySQL
11 3 (0.90%) Oracle Database
11 3 (0.90%) Oracle Reports
11 3 (0.90%) SAP BW
11 3 (0.90%) SQL Server Integration Services
11 3 (0.90%) SQL Server Reporting Services
Development Applications
1 9 (2.69%) JIRA
2 7 (2.10%) Git
3 4 (1.20%) Selenium
4 3 (0.90%) ERwin
4 3 (0.90%) GitLab
4 3 (0.90%) JUnit
5 2 (0.60%) Bitbucket Server
5 2 (0.60%) DbUnit
5 2 (0.60%) ER Studio
5 2 (0.60%) Jenkins
5 2 (0.60%) jMock
5 2 (0.60%) Maven
5 2 (0.60%) Mocha
5 2 (0.60%) Mockito
5 2 (0.60%) PowerDesigner
5 2 (0.60%) SonarQube
6 1 (0.30%) Cypress.io
6 1 (0.30%) TestComplete
6 1 (0.30%) Visual Studio
6 1 (0.30%) WebDriver
General
1 158 (47.31%) Social Skills
2 105 (31.44%) Finance
3 46 (13.77%) Marketing
4 29 (8.68%) Retail
5 28 (8.38%) Public Sector
6 23 (6.89%) Inclusion and Diversity
7 21 (6.29%) Manufacturing
8 18 (5.39%) Law
9 13 (3.89%) Organisational Skills
10 10 (2.99%) Financial Institution
10 10 (2.99%) Presentation Skills
11 8 (2.40%) Telecoms
12 7 (2.10%) Legal
13 5 (1.50%) Advertising
13 5 (1.50%) Banking
13 5 (1.50%) Influencing Skills
13 5 (1.50%) Local Government
14 4 (1.20%) Billing
15 3 (0.90%) Documentation Skills
16 2 (0.60%) Public Speaking
Job Titles
1 82 (24.55%) Analyst
2 40 (11.98%) Trainer
3 28 (8.38%) Developer
4 24 (7.19%) Lead
5 23 (6.89%) Business Analyst
6 22 (6.59%) Support Analyst
7 21 (6.29%) Architect
8 20 (5.99%) Consultant
9 16 (4.79%) Senior
10 15 (4.49%) Data Analyst
11 14 (4.19%) IT Support
12 11 (3.29%) IT Analyst
13 10 (2.99%) Financial Analyst
13 10 (2.99%) Risk Manager
13 10 (2.99%) Systems Analyst
14 8 (2.40%) E-Commerce Manager
14 8 (2.40%) Integration Developer
14 8 (2.40%) NetSuite Consultant
14 8 (2.40%) SAP Developer
15 7 (2.10%) Finance Business Analyst
Libraries, Frameworks & Software Standards
1 16 (4.79%) React
2 15 (4.49%) REST
3 13 (3.89%) Middleware
4 11 (3.29%) SOAP
5 10 (2.99%) HTML
6 9 (2.69%) BAPI
6 9 (2.69%) IBM Integration Bus
6 9 (2.69%) JMS
6 9 (2.69%) OAuth
6 9 (2.69%) SAML
7 8 (2.40%) .NET
7 8 (2.40%) CSS
7 8 (2.40%) Node.js
8 6 (1.80%) AngularJS
8 6 (1.80%) Elastic Stack
8 6 (1.80%) Oracle Fusion
8 6 (1.80%) Web Services
9 5 (1.50%) Hibernate
9 5 (1.50%) Spring
10 4 (1.20%) EDI
Miscellaneous
1 25 (7.49%) Onboarding
2 21 (6.29%) Analytical Mindset
2 21 (6.29%) Legacy Systems
3 19 (5.69%) Self-Motivation
4 10 (2.99%) Enterprise Software
5 9 (2.69%) Data Structures
6 8 (2.40%) Robotics
7 7 (2.10%) Credit Risk
7 7 (2.10%) Driving Licence
7 7 (2.10%) Taxonomies
8 6 (1.80%) Marketing Technology
8 6 (1.80%) Mobile App
8 6 (1.80%) Product Ownership
9 5 (1.50%) Cyber Threat
9 5 (1.50%) Management Information System
9 5 (1.50%) Security Posture
10 4 (1.20%) Cyber Defence
11 3 (0.90%) Data Centre
11 3 (0.90%) e-Learning
11 3 (0.90%) Legacy Applications
Operating Systems
1 17 (5.09%) Windows
2 12 (3.59%) Windows Server
3 10 (2.99%) Linux
4 6 (1.80%) Apple iOS
4 6 (1.80%) Mac OS
5 2 (0.60%) Red Hat Enterprise Linux
5 2 (0.60%) Unix
5 2 (0.60%) Windows Server 2003
5 2 (0.60%) Windows Server 2019
6 1 (0.30%) Android
Processes & Methodologies
1 141 (42.22%) Problem-Solving
2 77 (23.05%) Artificial Intelligence
3 63 (18.86%) Stakeholder Management
4 62 (18.56%) Agile
5 61 (18.26%) Continuous Improvement
6 54 (16.17%) CRM
7 52 (15.57%) Analytics
8 51 (15.27%) Collaborative Working
9 50 (14.97%) Decision-Making
9 50 (14.97%) Project Management
10 46 (13.77%) Chemistry
11 35 (10.48%) B2B
11 35 (10.48%) Computer Science
12 34 (10.18%) Conversational UI
12 34 (10.18%) Requirements Gathering
13 32 (9.58%) Business Intelligence
14 31 (9.28%) ERP
14 31 (9.28%) Migration
15 30 (8.98%) E-Commerce
15 30 (8.98%) Risk Management
Programming Languages
1 68 (20.36%) SQL
2 21 (6.29%) Python
3 15 (4.49%) JavaScript
4 14 (4.19%) Java
5 11 (3.29%) C#
6 6 (1.80%) PL/SQL
6 6 (1.80%) PowerShell
6 6 (1.80%) T-SQL
7 5 (1.50%) Bash
7 5 (1.50%) R
7 5 (1.50%) TypeScript
8 4 (1.20%) C++
8 4 (1.20%) Perl
9 2 (0.60%) ABAP
9 2 (0.60%) Data Analysis Expressions
9 2 (0.60%) Shell Script
9 2 (0.60%) VBA
10 1 (0.30%) Go
10 1 (0.30%) PHP
10 1 (0.30%) Rust
Qualifications
1 116 (34.73%) Degree
2 35 (10.48%) PhD
3 34 (10.18%) Master's Degree
4 22 (6.59%) Security Cleared
5 21 (6.29%) Computer Science Degree
6 13 (3.89%) SC Cleared
7 12 (3.59%) CISSP
8 8 (2.40%) Cisco Certification
8 8 (2.40%) DV Cleared
9 7 (2.10%) ITIL Certification
10 6 (1.80%) CCNA
10 6 (1.80%) CCNP
10 6 (1.80%) CISM
11 5 (1.50%) SANS
12 4 (1.20%) DBS Check
12 4 (1.20%) ISTQB
12 4 (1.20%) JNCIS
13 3 (0.90%) TOGAF Certification
14 2 (0.60%) Azure Certification
14 2 (0.60%) CompTIA CySA+
Quality Assurance & Compliance
1 15 (4.49%) GDPR
2 14 (4.19%) Data Quality
2 14 (4.19%) QA
3 13 (3.89%) PMO
4 9 (2.69%) ISO/IEC 27001
5 8 (2.40%) SLA
6 6 (1.80%) Actionable Recommendations
6 6 (1.80%) California Consumer Privacy Act
7 4 (1.20%) NIST
8 3 (0.90%) SOC 2
9 2 (0.60%) Accessibility
9 2 (0.60%) Cyber Essentials
9 2 (0.60%) IFRS
10 1 (0.30%) COBIT
10 1 (0.30%) P3O
System Software
1 17 (5.09%) Active Directory
2 4 (1.20%) Docker
3 3 (0.90%) Hyper-V
4 2 (0.60%) Postfix
4 2 (0.60%) VMware Infrastructure
Systems Management
1 6 (1.80%) Kubernetes
2 4 (1.20%) SCOM
3 3 (0.90%) Ansible
3 3 (0.90%) Grafana
3 3 (0.90%) Prometheus
4 2 (0.60%) Kibana
4 2 (0.60%) Oracle RMAN
4 2 (0.60%) Progress Chef
4 2 (0.60%) Puppet
4 2 (0.60%) SCCM
4 2 (0.60%) SCOrch
4 2 (0.60%) SCSM
4 2 (0.60%) Terraform
5 1 (0.30%) AirWatch
5 1 (0.30%) EMC NetWorker
Vendors
1 63 (18.86%) Microsoft
2 33 (9.88%) PayPal
3 32 (9.58%) Google
4 25 (7.49%) SAP
5 16 (4.79%) Databricks
5 16 (4.79%) Oracle
6 9 (2.69%) Adobe
6 9 (2.69%) IBM
7 8 (2.40%) Salesforce
8 7 (2.10%) Avaloq
8 7 (2.10%) Cisco
9 6 (1.80%) Apple
9 6 (1.80%) Splunk
10 4 (1.20%) Juniper
10 4 (1.20%) LogRhythm
10 4 (1.20%) Okta
10 4 (1.20%) ServiceNow
11 3 (0.90%) Informatica
11 3 (0.90%) VMware
12 2 (0.60%) QAD