Inclusion and Diversity Jobs in the West Midlands

Inclusion and Diversity
England > West Midlands

The table below looks at the prevalence of the term Inclusion and Diversity in permanent job vacancies in the West Midlands. Included is a benchmarking guide to the salaries offered in vacancies that cited Inclusion and Diversity over the 6 months leading up to 30 April 2025, comparing them to the same period in the previous two years.

6 months to
30 Apr 2025
Same period 2024 Same period 2023
Rank 63 41 92
Rank change year-on-year -22 +51 +59
Permanent jobs citing Inclusion and Diversity 177 342 235
As % of all permanent jobs advertised in the West Midlands 3.96% 4.72% 3.53%
As % of the General category 7.20% 8.14% 4.62%
Number of salaries quoted 88 195 51
10th Percentile £36,000 £24,696 £34,452
25th Percentile £44,000 £31,750 £38,966
Median annual salary (50th Percentile) £55,000 £47,450 £55,000
Median % change year-on-year +15.91% -13.73% +10.00%
75th Percentile £63,750 £62,500 £65,000
90th Percentile £80,000 £71,725 £72,500
England median annual salary £55,000 £51,700 £70,000
% change year-on-year +6.38% -26.14% +18.02%

All General Skills
West Midlands

Inclusion and Diversity falls under the General Skills category. For comparison with the information above, the following table provides summary statistics for all permanent job vacancies requiring common skills in the West Midlands.

Permanent vacancies with a requirement for common skills 2,458 4,203 5,090
As % of all permanent jobs advertised in the West Midlands 55.05% 58.05% 76.37%
Number of salaries quoted 1,097 3,025 2,262
10th Percentile £29,000 £25,750 £29,750
25th Percentile £36,995 £32,500 £37,500
Median annual salary (50th Percentile) £52,500 £47,500 £52,500
Median % change year-on-year +10.53% -9.52% +9.38%
75th Percentile £65,000 £62,500 £67,500
90th Percentile £77,500 £73,950 £77,500
England median annual salary £57,500 £52,500 £60,063
% change year-on-year +9.52% -12.59% +0.11%

Inclusion and Diversity
Job Vacancy Trend in the West Midlands

Job postings citing Inclusion and Diversity as a proportion of all IT jobs advertised in the West Midlands.
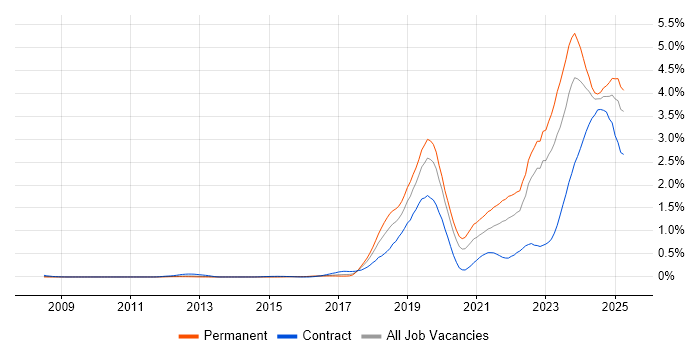
Job vacancy trend for Inclusion and Diversity in the West Midlands

Inclusion and Diversity
Salary Trend in the West Midlands

3-month moving average salary quoted in jobs citing Inclusion and Diversity in the West Midlands.

Salary trend for Inclusion and Diversity in the West Midlands

Inclusion and Diversity
Salary Histogram in the West Midlands

Salary distribution for jobs citing Inclusion and Diversity in the West Midlands over the 6 months to 30 April 2025.

Salary histogram for Inclusion and Diversity in the West Midlands

Inclusion and Diversity
Job Locations in the West Midlands

The table below looks at the demand and provides a guide to the median salaries quoted in IT jobs citing Inclusion and Diversity within the West Midlands region over the 6 months to 30 April 2025. The 'Rank Change' column provides an indication of the change in demand within each location based on the same 6 month period last year.

Location Rank Change
on Same Period
Last Year
Matching
Permanent
IT Job Ads
Median Salary
Past 6 Months
Median Salary
% Change
on Same Period
Last Year
Live
Jobs
Birmingham +11 110 £57,500 +33.02% 66
Warwickshire -52 28 £53,750 -6.52% 33
Solihull +2 15 £43,250 -13.50% 4
Staffordshire +3 7 £53,300 +87.01% 49
Dudley +4 6 £70,000 -5.15% 3
Worcestershire +20 5 £45,000 -25.00% 7
Coventry -6 2 £44,822 +5.46% 10
Herefordshire - 2 - -
Inclusion and Diversity
England

Inclusion and Diversity
Co-occurring Skills and Capabilities in the West Midlands by Category

The follow tables expand on the table above by listing co-occurrences grouped by category. The same employment type, locality and period is covered with up to 20 co-occurrences shown in each of the following categories:

Application Platforms
1 9 (5.08%) Skype for Business
2 6 (3.39%) SharePoint
3 3 (1.69%) Microsoft Exchange
4 2 (1.13%) Jupyter
5 1 (0.56%) Confluence
5 1 (0.56%) IBM Notes
Applications
1 8 (4.52%) Microsoft Excel
1 8 (4.52%) Microsoft PowerPoint
2 7 (3.95%) Microsoft Office
3 2 (1.13%) MS Visio
4 1 (0.56%) Adobe After Effects
4 1 (0.56%) Adobe Premiere
Business Applications
1 22 (12.43%) Oracle EBS
2 12 (6.78%) Oracle Applications
3 4 (2.26%) Oracle ERP
3 4 (2.26%) PeopleSoft HCM
3 4 (2.26%) SAP HCM
4 1 (0.56%) Remedy ITSM
4 1 (0.56%) Shopify
Cloud Services
1 50 (28.25%) Azure
2 28 (15.82%) AWS
3 7 (3.95%) Microsoft 365
3 7 (3.95%) SaaS
4 6 (3.39%) Azure Data Factory
4 6 (3.39%) Azure DevOps
4 6 (3.39%) IBM Cloud
5 5 (2.82%) Azure Service Bus
5 5 (2.82%) Entra ID
5 5 (2.82%) Microsoft Purview
6 4 (2.26%) Amazon EC2
6 4 (2.26%) Azure Sentinel
6 4 (2.26%) Boomi
6 4 (2.26%) OCI
6 4 (2.26%) Power Platform
6 4 (2.26%) Route 53
7 3 (1.69%) Dynamics 365
7 3 (1.69%) OneDrive
7 3 (1.69%) Power Automate
7 3 (1.69%) PowerApps
Communications & Networking
1 13 (7.34%) Firewall
1 13 (7.34%) WAN
2 9 (5.08%) LAN
2 9 (5.08%) Skype
2 9 (5.08%) Unified Communications
2 9 (5.08%) Wireless
3 8 (4.52%) VPN
4 6 (3.39%) Network Security
5 5 (2.82%) MPLS
6 4 (2.26%) HTTP
6 4 (2.26%) HTTPS
6 4 (2.26%) SD-WAN
6 4 (2.26%) VLAN
6 4 (2.26%) Wi-Fi
7 3 (1.69%) Internet
7 3 (1.69%) TCP/IP
7 3 (1.69%) WLAN
8 2 (1.13%) IPsec
8 2 (1.13%) VoIP
9 1 (0.56%) LTE
Database & Business Intelligence
1 10 (5.65%) Data Warehouse
2 9 (5.08%) SQL Server
3 8 (4.52%) Oracle Database
4 5 (2.82%) Metadata
5 4 (2.26%) Big Data
5 4 (2.26%) Data Hub
5 4 (2.26%) Metadata Repository
5 4 (2.26%) Oracle Exadata
6 3 (1.69%) Azure SQL Data Warehouse
6 3 (1.69%) Power BI
7 2 (1.13%) Elasticsearch
8 1 (0.56%) Amazon RDS
8 1 (0.56%) PostgreSQL
8 1 (0.56%) Redis
8 1 (0.56%) SQL Server Integration Services
8 1 (0.56%) Tableau
Development Applications
1 6 (3.39%) Git
2 4 (2.26%) JUnit
2 4 (2.26%) NUnit
3 2 (1.13%) Cucumber
3 2 (1.13%) JIRA
3 2 (1.13%) Mocha
3 2 (1.13%) Robot Framework
4 1 (0.56%) SQL Server Management Studio (SSMS)
4 1 (0.56%) Visual Studio
General
1 41 (23.16%) Social Skills
2 31 (17.51%) Finance
3 22 (12.43%) Analytical Skills
4 15 (8.47%) Public Sector
5 8 (4.52%) Manufacturing
6 7 (3.95%) Telecoms
7 6 (3.39%) Law
7 6 (3.39%) Legal
8 3 (1.69%) Organisational Skills
8 3 (1.69%) Retail
9 2 (1.13%) Billing
9 2 (1.13%) Influencing Skills
9 2 (1.13%) Police
9 2 (1.13%) Presentation Skills
10 1 (0.56%) Banking
10 1 (0.56%) Documentation Skills
10 1 (0.56%) Electronics
10 1 (0.56%) Games
Job Titles
1 37 (20.90%) Senior
2 18 (10.17%) Architect
3 15 (8.47%) Analyst
4 14 (7.91%) Lead
5 13 (7.34%) Consultant
5 13 (7.34%) Senior Architect
5 13 (7.34%) Senior Solutions Architect
5 13 (7.34%) Solutions Architect
6 12 (6.78%) Developer
6 12 (6.78%) Project Manager
6 12 (6.78%) Support Engineer
7 10 (5.65%) IT Consultant
8 9 (5.08%) Collaboration Specialist
8 9 (5.08%) Senior Manager
9 8 (4.52%) Applications Support
9 8 (4.52%) Azure Architect
9 8 (4.52%) Infrastructure Engineer
9 8 (4.52%) Senior Project Manager
9 8 (4.52%) Service Analyst
10 7 (3.95%) Service Manager
Libraries, Frameworks & Software Standards
1 18 (10.17%) Middleware
1 18 (10.17%) Oracle Fusion
2 9 (5.08%) EDI
3 8 (4.52%) .NET
4 7 (3.95%) Node.js
5 6 (3.39%) Jest
5 6 (3.39%) React
6 5 (2.82%) .NET Core
6 5 (2.82%) REST
7 4 (2.26%) Oracle GoldenGate
8 2 (1.13%) Kafka
8 2 (1.13%) Tailwind CSS
9 1 (0.56%) Alpine.js
9 1 (0.56%) CSS
9 1 (0.56%) Django
9 1 (0.56%) HTML
9 1 (0.56%) Pandas
9 1 (0.56%) RESTful
9 1 (0.56%) Visualforce
9 1 (0.56%) YAML
Miscellaneous
1 21 (11.86%) Management Information System
2 10 (5.65%) Data Centre
3 9 (5.08%) Digital Signage
3 9 (5.08%) Video Conferencing
4 8 (4.52%) Cyberattack
5 5 (2.82%) Driving Licence
6 4 (2.26%) Algorithms
6 4 (2.26%) Enterprise Software
6 4 (2.26%) Linux Command Line
6 4 (2.26%) Operational Technology
7 3 (1.69%) Hybrid Cloud
7 3 (1.69%) Mobile App
7 3 (1.69%) Renewable Energy
7 3 (1.69%) SCADA
7 3 (1.69%) Self-Motivation
8 2 (1.13%) CCTV
9 1 (0.56%) Animation
9 1 (0.56%) Graphic Design
9 1 (0.56%) Photography
9 1 (0.56%) Video Editing
Operating Systems
1 27 (15.25%) Windows
2 11 (6.21%) Linux
3 10 (5.65%) Windows Server
4 5 (2.82%) Unix
5 4 (2.26%) Android
6 3 (1.69%) Apple iOS
7 2 (1.13%) Oracle Linux
8 1 (0.56%) Windows 10
Processes & Methodologies
1 38 (21.47%) Problem-Solving
2 35 (19.77%) ITIL
3 27 (15.25%) Stakeholder Management
4 26 (14.69%) Mentoring
5 19 (10.73%) DevOps
6 18 (10.17%) Continuous Improvement
7 17 (9.60%) Agile
8 16 (9.04%) Roadmaps
8 16 (9.04%) Service Delivery
9 15 (8.47%) Coaching
9 15 (8.47%) Project Management
10 14 (7.91%) Business Transformation
10 14 (7.91%) ERP
10 14 (7.91%) Proactive Monitoring
11 13 (7.34%) Project Delivery
12 12 (6.78%) Analytics
12 12 (6.78%) Cybersecurity
12 12 (6.78%) Disaster Recovery
13 11 (6.21%) Incident Management
13 11 (6.21%) Time Management
Programming Languages
1 23 (12.99%) SQL
2 9 (5.08%) JavaScript
3 8 (4.52%) Python
4 7 (3.95%) PowerShell
5 6 (3.39%) C#
6 4 (2.26%) Java
6 4 (2.26%) PL/SQL
6 4 (2.26%) Shell Script
7 3 (1.69%) Bash
7 3 (1.69%) T-SQL
8 2 (1.13%) PHP
9 1 (0.56%) C++
9 1 (0.56%) Go
9 1 (0.56%) Rust
Qualifications
1 40 (22.60%) Degree
2 17 (9.60%) Security Cleared
3 10 (5.65%) HND
4 7 (3.95%) AWS Certification
4 7 (3.95%) SC Cleared
5 6 (3.39%) DV Cleared
5 6 (3.39%) Microsoft Certification
5 6 (3.39%) Oracle Certification
6 5 (2.82%) CompTIA Security+
6 5 (2.82%) DBS Check
7 4 (2.26%) Azure Certification
7 4 (2.26%) CCNA
7 4 (2.26%) Cisco Certification
7 4 (2.26%) CITP
7 4 (2.26%) MRICS
7 4 (2.26%) OCA
7 4 (2.26%) OCP
8 3 (1.69%) AWS Certified Solutions Architect
8 3 (1.69%) CCIE
8 3 (1.69%) CCNP
Quality Assurance & Compliance
1 12 (6.78%) SLA
2 4 (2.26%) Accessibility
2 4 (2.26%) QA
3 3 (1.69%) Data Quality
4 2 (1.13%) NCSC
5 1 (0.56%) GDPR
5 1 (0.56%) ISO/IEC 27001
5 1 (0.56%) ISO/IEC 27002 (supersedes ISO/IEC 17799)
5 1 (0.56%) NEBOSH
5 1 (0.56%) PMBOK
System Software
1 16 (9.04%) Active Directory
2 9 (5.08%) Virtual Desktop
3 7 (3.95%) VMware Infrastructure
4 4 (2.26%) Docker
4 4 (2.26%) Virtual Machines
5 1 (0.56%) vSphere
Systems Management
1 8 (4.52%) Terraform
2 7 (3.95%) Ansible
3 5 (2.82%) Microsoft Intune
4 4 (2.26%) Oracle RMAN
5 3 (1.69%) AirWatch
5 3 (1.69%) Kubernetes
6 2 (1.13%) Cisco CUCM
6 2 (1.13%) Single Sign-On
7 1 (0.56%) AWS Copilot
7 1 (0.56%) Puppet
Vendors
1 53 (29.94%) Microsoft
2 27 (15.25%) Oracle
3 24 (13.56%) ServiceNow
4 23 (12.99%) Cisco
5 11 (6.21%) Apple
6 10 (5.65%) Dell
6 10 (5.65%) SAP
7 9 (5.08%) Adobe
7 9 (5.08%) Mitel
7 9 (5.08%) Polycom
7 9 (5.08%) ShoreTel
8 8 (4.52%) IBM
8 8 (4.52%) VMware
9 7 (3.95%) Informatica
9 7 (3.95%) YouTube
10 6 (3.39%) JD Edwards
10 6 (3.39%) LogicMonitor
10 6 (3.39%) McAfee
10 6 (3.39%) SolarWinds
10 6 (3.39%) Veeam