JavaScript Jobs in Yorkshire

JavaScript (including ECMAScript)
England > Yorkshire

The table below provides summary statistics for permanent job vacancies advertised in Yorkshire requiring JavaScript skills. It includes a benchmarking guide to the annual salaries offered in vacancies that cited JavaScript over the 6 months leading up to 26 October 2024, comparing them to the same period in the previous two years.

6 months to
26 Oct 2024
Same period 2023 Same period 2022
Rank 30 21 14
Rank change year-on-year -9 -7 -5
Permanent jobs citing JavaScript 242 355 925
As % of all permanent jobs advertised in Yorkshire 5.30% 9.62% 13.57%
As % of the Programming Languages category 23.34% 25.43% 30.70%
Number of salaries quoted 115 308 619
10th Percentile £31,250 £36,775 £37,500
25th Percentile £42,500 £45,000 £42,500
Median annual salary (50th Percentile) £55,000 £55,000 £55,000
Median % change year-on-year - - +10.00%
75th Percentile £63,750 £71,250 £72,500
90th Percentile £93,750 £84,714 £82,500
England median annual salary £65,000 £65,000 £62,500
% change year-on-year - +4.00% +8.70%

All Programming Languages
Yorkshire

JavaScript falls under the Programming Languages category. For comparison with the information above, the following table provides summary statistics for all permanent job vacancies requiring coding skills in Yorkshire.

Permanent vacancies with a requirement for coding skills 1,037 1,396 3,013
As % of all permanent jobs advertised in Yorkshire 22.69% 37.84% 44.20%
Number of salaries quoted 524 1,046 1,955
10th Percentile £34,400 £35,000 £33,675
25th Percentile £42,500 £42,874 £41,326
Median annual salary (50th Percentile) £55,000 £55,000 £54,882
Median % change year-on-year - +0.22% +9.76%
75th Percentile £68,750 £69,040 £70,000
90th Percentile £80,000 £82,548 £85,000
England median annual salary £65,000 £65,000 £65,000
% change year-on-year - - +8.33%

JavaScript
Job Vacancy Trend in Yorkshire

Job postings citing JavaScript as a proportion of all IT jobs advertised in Yorkshire.
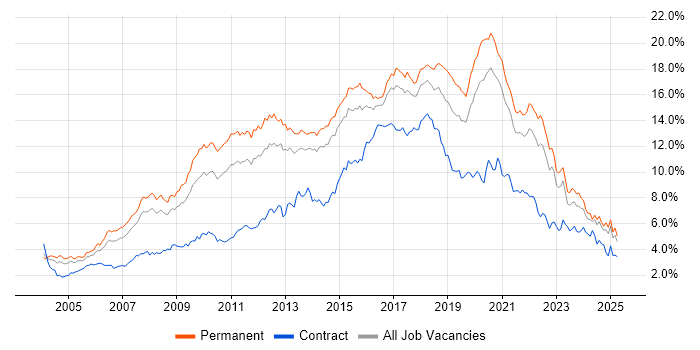
Job vacancy trend for JavaScript in Yorkshire

JavaScript
Salary Trend in Yorkshire

3-month moving average salary quoted in jobs citing JavaScript in Yorkshire.

Salary trend for JavaScript in Yorkshire

JavaScript
Salary Histogram in Yorkshire

Salary distribution for jobs citing JavaScript in Yorkshire over the 6 months to 26 October 2024.

Salary histogram for JavaScript in Yorkshire

JavaScript
Job Locations in Yorkshire

The table below looks at the demand and provides a guide to the median salaries quoted in IT jobs citing JavaScript within the Yorkshire region over the 6 months to 26 October 2024. The 'Rank Change' column provides an indication of the change in demand within each location based on the same 6 month period last year.

Location Rank Change
on Same Period
Last Year
Matching
Permanent
IT Job Ads
Median Salary
Past 6 Months
Median Salary
% Change
on Same Period
Last Year
Live
Jobs
West Yorkshire -11 104 £55,000 -8.33% 49
South Yorkshire +25 73 £55,000 +4.76% 24
East Yorkshire -10 20 £42,500 -15.00% 9
North Yorkshire -7 12 £50,000 +5.82% 13
Humberside - 10 £55,000 - 2
JavaScript
England

JavaScript
Co-occurring Skills and Capabilities in Yorkshire by Category

The follow tables expand on the table above by listing co-occurrences grouped by category. The same employment type, locality and period is covered with up to 20 co-occurrences shown in each of the following categories:

Application Platforms
1 13 (5.37%) CMS
2 3 (1.24%) Appian
2 3 (1.24%) Tomcat
2 3 (1.24%) Umbraco
2 3 (1.24%) WordPress
3 2 (0.83%) IIS
3 2 (0.83%) SharePoint
4 1 (0.41%) Apache
4 1 (0.41%) Apache Spark
4 1 (0.41%) Cloud Foundry
4 1 (0.41%) Confluence
4 1 (0.41%) Joomla!
4 1 (0.41%) Oracle SOA Suite
4 1 (0.41%) WinCC
Applications
1 9 (3.72%) Adobe XD
2 2 (0.83%) Chatbot
2 2 (0.83%) Microsoft Excel
2 2 (0.83%) Sketch
Business Applications
1 7 (2.89%) Dynamics CRM
2 5 (2.07%) Oracle EBS
3 1 (0.41%) SAP ERP
Cloud Services
1 80 (33.06%) Azure
2 57 (23.55%) AWS
3 54 (22.31%) GitHub
4 21 (8.68%) SaaS
5 17 (7.02%) GCP
6 14 (5.79%) Power Platform
7 10 (4.13%) Azure DevOps
7 10 (4.13%) Figma
8 7 (2.89%) Dynamics 365
8 7 (2.89%) PowerApps
9 6 (2.48%) Azure Cosmos DB
9 6 (2.48%) OCI
10 5 (2.07%) AWS CloudFormation
11 4 (1.65%) GitHub Actions
11 4 (1.65%) Power Automate
12 3 (1.24%) Google Analytics
12 3 (1.24%) Slack
13 2 (0.83%) Azure Monitor
13 2 (0.83%) Cloud Computing
13 2 (0.83%) Firebase
Communications & Networking
1 5 (2.07%) HTTP
2 1 (0.41%) 3G
2 1 (0.41%) 4G
2 1 (0.41%) Broadband
2 1 (0.41%) DNS
2 1 (0.41%) FTP
2 1 (0.41%) MQTT
2 1 (0.41%) RS-485
2 1 (0.41%) SSH
2 1 (0.41%) TCP/IP
2 1 (0.41%) Wi-Fi
2 1 (0.41%) Wireless
Database & Business Intelligence
1 39 (16.12%) MySQL
2 28 (11.57%) SQL Server
3 20 (8.26%) NoSQL
4 13 (5.37%) MongoDB
5 11 (4.55%) PostgreSQL
6 8 (3.31%) Power BI
7 6 (2.48%) Relational Database
8 5 (2.07%) Elasticsearch
8 5 (2.07%) Oracle ODI
8 5 (2.07%) Oracle Reports
9 4 (1.65%) SQLite
10 2 (0.83%) Data Warehouse
11 1 (0.41%) BusinessObjects
11 1 (0.41%) Data Mining
11 1 (0.41%) GIS
11 1 (0.41%) Hadoop
11 1 (0.41%) MS Access
11 1 (0.41%) Oracle Database
11 1 (0.41%) RDBMS
11 1 (0.41%) Spotfire
Development Applications
1 47 (19.42%) Git
2 13 (5.37%) Visual Studio
3 11 (4.55%) Jenkins
4 9 (3.72%) Selenium
5 7 (2.89%) Cypress.io
6 6 (2.48%) Browser DevTools
6 6 (2.48%) Gatling
6 6 (2.48%) GitLab
6 6 (2.48%) JIRA
6 6 (2.48%) JMeter
7 5 (2.07%) Oracle APEX
7 5 (2.07%) Oracle Forms
8 4 (1.65%) Robot Framework
8 4 (1.65%) Visual Studio Code
9 3 (1.24%) Maven
9 3 (1.24%) Subversion
10 2 (0.83%) Bitbucket
10 2 (0.83%) Cucumber
10 2 (0.83%) Mocha
10 2 (0.83%) WebDriver
General
1 53 (21.90%) Social Skills
2 38 (15.70%) Multimedia
3 14 (5.79%) Public Sector
4 12 (4.96%) Analytical Skills
5 8 (3.31%) Finance
5 8 (3.31%) Legal
6 7 (2.89%) Manufacturing
6 7 (2.89%) Marketing
6 7 (2.89%) Tech for Good
7 5 (2.07%) Inclusion and Diversity
8 3 (1.24%) Games
8 3 (1.24%) Retail
9 2 (0.83%) Automotive
9 2 (0.83%) Law
9 2 (0.83%) Pharmaceutical
9 2 (0.83%) Publishing
10 1 (0.41%) Banking
10 1 (0.41%) Dutch Language
10 1 (0.41%) Music Industry
10 1 (0.41%) Presentation Skills
Job Titles
1 148 (61.16%) Developer
2 57 (23.55%) Software Engineer
3 56 (23.14%) Senior
4 42 (17.36%) Web Developer
5 36 (14.88%) Trainee Developer
5 36 (14.88%) Trainee Web Developer
6 29 (11.98%) .NET Developer
7 24 (9.92%) Front-End Developer (Client-Side Developer)
8 21 (8.68%) C# Developer
9 20 (8.26%) Senior Software Engineer
10 18 (7.44%) C# .NET Developer
10 18 (7.44%) Senior Developer
11 17 (7.02%) PHP Developer
12 13 (5.37%) Software Developer
13 9 (3.72%) .NET Software Engineer
13 9 (3.72%) Agile .NET Developer
13 9 (3.72%) Agile C# Developer
13 9 (3.72%) Agile Developer
14 8 (3.31%) Senior .NET Developer
15 7 (2.89%) React Developer
Libraries, Frameworks & Software Standards
1 123 (50.83%) HTML
2 118 (48.76%) CSS
3 90 (37.19%) .NET
4 78 (32.23%) React
5 56 (23.14%) AngularJS
6 49 (20.25%) RESTful
7 44 (18.18%) Node.js
8 40 (16.53%) HTML5
9 37 (15.29%) CSS3
10 31 (12.81%) REST
11 29 (11.98%) ASP.NET
12 27 (11.16%) Vue
13 20 (8.26%) JSON
14 19 (7.85%) GraphQL
15 18 (7.44%) .NET Core
15 18 (7.44%) .NET Framework
16 17 (7.02%) jQuery
17 16 (6.61%) ASP.NET Web API
17 16 (6.61%) Web Services
18 13 (5.37%) ASP.NET MVC
Miscellaneous
1 7 (2.89%) Product Ownership
2 6 (2.48%) Onboarding
2 6 (2.48%) Robotics
3 5 (2.07%) Greenfield Project
3 5 (2.07%) Low-Code
4 4 (1.65%) Blog
4 4 (1.65%) Hackathon
4 4 (1.65%) Linux Command Line
5 3 (1.24%) Mobile App
5 3 (1.24%) Public Cloud
6 2 (0.83%) Fat Client
6 2 (0.83%) NHS
6 2 (0.83%) N-Tier
6 2 (0.83%) Renewable Energy
6 2 (0.83%) Self-Motivation
6 2 (0.83%) Social Media
6 2 (0.83%) Thin Client
6 2 (0.83%) Virtual Team
7 1 (0.41%) Management Information System
7 1 (0.41%) Mobile Games
Operating Systems
1 6 (2.48%) Linux
2 5 (2.07%) Windows
3 4 (1.65%) Unix
4 1 (0.41%) Android
4 1 (0.41%) Embedded Linux
4 1 (0.41%) Kali Linux
4 1 (0.41%) Windows 10
Processes & Methodologies
1 84 (34.71%) Agile
2 82 (33.88%) Full-Stack Development
3 80 (33.06%) Software Engineering
4 70 (28.93%) Web Development
5 50 (20.66%) Problem-Solving
6 39 (16.12%) DevOps
7 33 (13.64%) Front End Development
8 30 (12.40%) Mentoring
9 28 (11.57%) Microservices
9 28 (11.57%) MVC
10 26 (10.74%) User Experience
11 24 (9.92%) CI/CD
12 23 (9.50%) Artificial Intelligence
12 23 (9.50%) TDD
13 22 (9.09%) Infrastructure as Code
14 20 (8.26%) Scrum
15 18 (7.44%) OO
15 18 (7.44%) OOP
15 18 (7.44%) Test Automation
16 17 (7.02%) Continuous Improvement
Programming Languages
1 85 (35.12%) C#
2 71 (29.34%) SQL
3 60 (24.79%) Python
4 58 (23.97%) TypeScript
5 27 (11.16%) PHP
6 19 (7.85%) Java
7 9 (3.72%) T-SQL
8 5 (2.07%) PL/SQL
9 4 (1.65%) Bash
9 4 (1.65%) C++
10 3 (1.24%) VB.NET
11 2 (0.83%) C
11 2 (0.83%) PowerShell
12 1 (0.41%) Go
12 1 (0.41%) JSX
12 1 (0.41%) RPG
12 1 (0.41%) Ruby
Qualifications
1 21 (8.68%) Degree
2 10 (4.13%) SC Cleared
2 10 (4.13%) Security Cleared
3 8 (3.31%) Computer Science Degree
4 6 (2.48%) DV Cleared
5 4 (1.65%) HND
6 2 (0.83%) PhD
7 1 (0.41%) AWS Certification
7 1 (0.41%) Azure Certification
7 1 (0.41%) BPSS Clearance
7 1 (0.41%) CHECK Team Leader
7 1 (0.41%) CHECK Team Member
7 1 (0.41%) CIPD
7 1 (0.41%) DBS Check
7 1 (0.41%) Master's Degree
7 1 (0.41%) OSCP
Quality Assurance & Compliance
1 9 (3.72%) Accessibility
2 6 (2.48%) QA
3 2 (0.83%) GDPR
4 1 (0.41%) IEC 61131
System Software
1 4 (1.65%) Docker
2 3 (1.24%) Virtual Machines
3 1 (0.41%) Active Directory
Systems Management
1 21 (8.68%) Terraform
2 10 (4.13%) Kubernetes
3 1 (0.41%) Ansible
3 1 (0.41%) cPanel
3 1 (0.41%) Nmap
Vendors
1 19 (7.85%) Microsoft
2 11 (4.55%) Oracle
3 10 (4.13%) Google
4 9 (3.72%) Adobe
5 8 (3.31%) ServiceNow
6 4 (1.65%) EMC
6 4 (1.65%) SAP
7 3 (1.24%) DevExpress
8 2 (0.83%) ANSYS
9 1 (0.41%) Alteryx
9 1 (0.41%) Black Duck
9 1 (0.41%) Databricks
9 1 (0.41%) Siemens
9 1 (0.41%) Snow