Continuous Improvement Job Trends in Yorkshire

Continual Improvement
England > Yorkshire

The table below provides summary statistics and salary benchmarking for jobs advertised in Yorkshire requiring Continuous Improvement skills. It covers permanent job vacancies from the 6 months leading up to 17 October 2025, with comparisons to the same periods in the previous two years.

6 months to
17 Oct 2025
Same period 2024 Same period 2023
Rank 23 40 64
Rank change year-on-year +17 +24 -31
Permanent jobs citing Continuous Improvement 271 182 153
As % of all permanent jobs in Yorkshire 8.09% 4.16% 4.38%
As % of the Processes & Methodologies category 9.23% 5.21% 4.58%
Number of salaries quoted 125 75 118
10th Percentile £31,250 £31,250 £36,250
25th Percentile £39,000 £41,250 £40,313
Median annual salary (50th Percentile) £55,000 £49,493 £52,500
Median % change year-on-year +11.13% -5.73% -8.70%
75th Percentile £75,000 £64,375 £67,070
90th Percentile £85,000 £86,250 £82,500
England median annual salary £57,500 £60,000 £64,000
% change year-on-year -4.17% -6.25% +6.67%

All Process and Methodology Skills
Yorkshire

Continuous Improvement falls under the Processes and Methodologies category. For comparison with the information above, the following table provides summary statistics for all permanent job vacancies requiring process or methodology skills in Yorkshire.

Permanent vacancies with a requirement for process or methodology skills 2,937 3,494 3,339
As % of all permanent jobs advertised in Yorkshire 87.70% 79.92% 95.56%
Number of salaries quoted 1,402 1,522 2,469
10th Percentile £26,250 £30,625 £29,750
25th Percentile £31,000 £41,250 £39,250
Median annual salary (50th Percentile) £47,500 £52,500 £52,500
Median % change year-on-year -9.52% - -
75th Percentile £66,250 £68,750 £68,750
90th Percentile £80,000 £80,000 £83,750
England median annual salary £55,000 £60,000 £60,800
% change year-on-year -8.33% -1.32% +1.33%

Continuous Improvement
Job Vacancy Trend in Yorkshire

Historical trend showing the proportion of permanent IT job postings citing Continuous Improvement relative to all permanent IT jobs advertised in Yorkshire.

Continuous Improvement job vacancy trend in Yorkshire

Continuous Improvement
Salary Trend in Yorkshire

Salary distribution trend for jobs in Yorkshire citing Continuous Improvement.
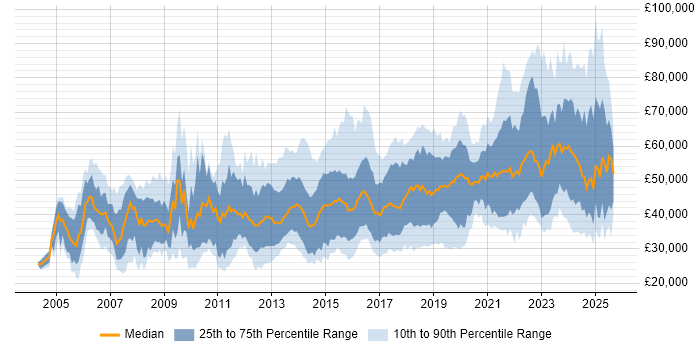
Salary distribution trend for jobs in Yorkshire citing Continuous Improvement

Continuous Improvement
Salary Histogram in Yorkshire

Salary distribution for jobs citing Continuous Improvement in Yorkshire over the 6 months to 17 October 2025.

Salary histogram for Continuous Improvement in Yorkshire

Continuous Improvement
Job Locations in Yorkshire

The table below looks at the demand and provides a guide to the median salaries quoted in IT jobs citing Continuous Improvement within the Yorkshire region over the 6 months to 17 October 2025. The 'Rank Change' column provides an indication of the change in demand within each location based on the same 6 month period last year.

Location Rank Change
on Same Period
Last Year
Matching
Permanent
IT Job Ads
Median Salary
Past 6 Months
Median Salary
% Change
on Same Period
Last Year
Live
Jobs
West Yorkshire +28 171 £62,617 +19.27% 105
North Yorkshire +3 44 £47,500 -42.42% 11
South Yorkshire +14 25 £35,000 -39.13% 25
East Yorkshire -8 20 £56,250 +18.42% 9
Continuous Improvement
England

Continuous Improvement
Co-Occurring Skills & Capabilities in Yorkshire by Category

The following tables expand on the one above by listing co-occurrences grouped by category. They cover the same employment type, locality and period, with up to 20 co-occurrences shown in each category:

Application Platforms
1 6 (2.21%) Confluence
1 6 (2.21%) SharePoint
2 3 (1.11%) CMS
3 2 (0.74%) Drupal
3 2 (0.74%) EPiServer
3 2 (0.74%) Umbraco
4 1 (0.37%) Apache
4 1 (0.37%) Apache Spark
4 1 (0.37%) Cloud Foundry
4 1 (0.37%) IIS
4 1 (0.37%) WordPress
Applications
1 13 (4.80%) Microsoft Office
2 10 (3.69%) SOLIDWORKS
3 6 (2.21%) AutoCAD
3 6 (2.21%) MS Visio
4 4 (1.48%) Autodesk Inventor
5 2 (0.74%) Chatbot
5 2 (0.74%) Microsoft Excel
5 2 (0.74%) Photoshop
5 2 (0.74%) Spreadsheet
6 1 (0.37%) Microsoft Project
Business Applications
1 7 (2.58%) SAP S/4HANA
2 4 (1.48%) Sage 200
2 4 (1.48%) SAP CO
2 4 (1.48%) SAP FI
2 4 (1.48%) SAP FI/CO
2 4 (1.48%) SAP PS
3 2 (0.74%) Dynamics CRM
3 2 (0.74%) Markit EDM
3 2 (0.74%) Oracle ERP
3 2 (0.74%) SAP GRC
3 2 (0.74%) SAP MDG
3 2 (0.74%) SAP MM
4 1 (0.37%) Primavera
4 1 (0.37%) SAP ERP
4 1 (0.37%) SAP PM
Cloud Services
1 49 (18.08%) Azure
2 42 (15.50%) AWS
3 24 (8.86%) SaaS
4 19 (7.01%) GCP
5 17 (6.27%) Microsoft 365
6 9 (3.32%) GitHub
7 8 (2.95%) AWS CloudFormation
8 7 (2.58%) OCI
9 6 (2.21%) Serverless
10 5 (1.85%) Power Platform
11 4 (1.48%) AWS Lambda
11 4 (1.48%) AWS Step Functions
12 3 (1.11%) Azure DevOps
12 3 (1.11%) Dynamics 365
12 3 (1.11%) Power Automate
13 2 (0.74%) Amazon ECS
13 2 (0.74%) Figma
13 2 (0.74%) npm
13 2 (0.74%) PowerApps
13 2 (0.74%) SuccessFactors
Communications & Networking
1 15 (5.54%) Firewall
2 12 (4.43%) VLAN
3 9 (3.32%) DNS
4 8 (2.95%) DHCP
4 8 (2.95%) VPN
5 7 (2.58%) BGP
5 7 (2.58%) TCP/IP
5 7 (2.58%) Wi-Fi
6 6 (2.21%) Network Security
6 6 (2.21%) OSPF
7 3 (1.11%) Broadband
7 3 (1.11%) Internet
7 3 (1.11%) WPA
8 2 (0.74%) AMQP
8 2 (0.74%) LAN
8 2 (0.74%) WAN
9 1 (0.37%) MPLS
9 1 (0.37%) VoIP
9 1 (0.37%) Wireless
Database & Business Intelligence
1 10 (3.69%) MySQL
2 9 (3.32%) SQL Server
3 5 (1.85%) MongoDB
3 5 (1.85%) PostgreSQL
4 4 (1.48%) Data Warehouse
4 4 (1.48%) Power BI
5 3 (1.11%) SAP HANA
5 3 (1.11%) Tableau
6 2 (0.74%) BusinessObjects
6 2 (0.74%) Metadata
6 2 (0.74%) NoSQL
6 2 (0.74%) SQL Server Analysis Services
6 2 (0.74%) SQL Server Integration Services
6 2 (0.74%) SQL Server Reporting Services
7 1 (0.37%) Amazon Aurora
7 1 (0.37%) Amazon Redshift
7 1 (0.37%) Apache Iceberg
7 1 (0.37%) Data Lake
7 1 (0.37%) Data Vault
7 1 (0.37%) Spark SQL
Development Applications
1 24 (8.86%) JIRA
2 6 (2.21%) Git
2 6 (2.21%) Jenkins
3 3 (1.11%) Selenium
4 2 (0.74%) GitLab
4 2 (0.74%) Grunt
4 2 (0.74%) gulp
4 2 (0.74%) JMeter
4 2 (0.74%) LoadRunner
4 2 (0.74%) SonarQube
4 2 (0.74%) webpack
5 1 (0.37%) Rational DOORS
General
1 102 (37.64%) Finance
2 92 (33.95%) Manufacturing
3 81 (29.89%) Social Skills
4 33 (12.18%) Marketing
5 17 (6.27%) Analytical Skills
6 13 (4.80%) Retail
7 11 (4.06%) Law
8 7 (2.58%) Influencing Skills
9 6 (2.21%) Legal
10 5 (1.85%) Public Sector
11 4 (1.48%) Electronics
11 4 (1.48%) Presentation Skills
12 3 (1.11%) Banking
13 2 (0.74%) Agriculture
14 1 (0.37%) Automotive
14 1 (0.37%) Documentation Skills
14 1 (0.37%) Games
14 1 (0.37%) Inclusion and Diversity
14 1 (0.37%) Organisational Skills
Job Titles
1 66 (24.35%) Automation Engineer
1 66 (24.35%) Systems Engineer
2 45 (16.61%) Developer
3 36 (13.28%) Lead
4 19 (7.01%) Development Manager
5 16 (5.90%) JIRA Developer
5 16 (5.90%) Product Manager
6 14 (5.17%) Product Development Manager
7 13 (4.80%) Senior
8 12 (4.43%) Consultant
9 11 (4.06%) IT Manager
9 11 (4.06%) Software Developer
10 10 (3.69%) Principal Consultant
10 10 (3.69%) Principal SAP Consultant
10 10 (3.69%) SAP Consultant
10 10 (3.69%) Support Engineer
11 9 (3.32%) Graduate
11 9 (3.32%) Software Engineer
12 8 (2.95%) Coordinator
13 7 (2.58%) Analyst
Libraries, Frameworks & Software Standards
1 17 (6.27%) .NET
1 17 (6.27%) CSS
2 16 (5.90%) React
3 11 (4.06%) Node.js
4 8 (2.95%) REST
4 8 (2.95%) RESTful
5 7 (2.58%) ASP.NET
6 6 (2.21%) HTML
6 6 (2.21%) Redux
7 5 (1.85%) GraphQL
7 5 (1.85%) jQuery
7 5 (1.85%) SAP Basis
7 5 (1.85%) SAP Fiori
8 4 (1.48%) React Native
8 4 (1.48%) Ruby on Rails
8 4 (1.48%) SAPUI5
9 3 (1.11%) SOAP
9 3 (1.11%) Spring
9 3 (1.11%) Spring Boot
9 3 (1.11%) Vue
Miscellaneous
1 83 (30.63%) FMCG
2 62 (22.88%) Management Information System
3 60 (22.14%) Manufacturing Execution System
3 60 (22.14%) Operational Technology
4 20 (7.38%) Onboarding
5 10 (3.69%) Cloud Native
5 10 (3.69%) Product Ownership
6 9 (3.32%) Distributed Systems
7 6 (2.21%) Self-Motivation
8 5 (1.85%) Marketing Technology
9 4 (1.48%) Public Cloud
10 3 (1.11%) CMDB
10 3 (1.11%) NHS
10 3 (1.11%) Private Cloud
11 2 (0.74%) Data Structures
11 2 (0.74%) e-Learning
11 2 (0.74%) Graphic Design
11 2 (0.74%) Mobile App
11 2 (0.74%) Replication
12 1 (0.37%) Hybrid Cloud
Operating Systems
1 19 (7.01%) Windows
2 9 (3.32%) Linux
2 9 (3.32%) Windows Server
3 3 (1.11%) Mac OS
4 2 (0.74%) SUSE
4 2 (0.74%) SUSE Linux Enterprise Server
5 1 (0.37%) Unix
Processes & Methodologies
1 132 (48.71%) Problem-Solving
2 61 (22.51%) Budgeting
3 60 (22.14%) Data Collection
3 60 (22.14%) Energy Management
3 60 (22.14%) Quality Management
4 53 (19.56%) Agile
5 37 (13.65%) Computer Science
5 37 (13.65%) ITIL
6 36 (13.28%) Mentoring
7 34 (12.55%) Project Management
8 33 (12.18%) Project Delivery
9 32 (11.81%) ITSM
10 29 (10.70%) Software Engineering
11 28 (10.33%) Decision-Making
12 27 (9.96%) Service Management
13 26 (9.59%) Change Management
14 24 (8.86%) CI/CD
14 24 (8.86%) DevOps
15 21 (7.75%) Process Improvement
15 21 (7.75%) Stakeholder Engagement
Programming Languages
1 37 (13.65%) JavaScript
2 28 (10.33%) PowerShell
3 26 (9.59%) Python
4 25 (9.23%) SQL
5 22 (8.12%) C#
6 11 (4.06%) Java
6 11 (4.06%) TypeScript
7 6 (2.21%) PHP
8 5 (1.85%) C++
9 4 (1.48%) Bash
9 4 (1.48%) Delphi
9 4 (1.48%) Ruby
10 2 (0.74%) ABAP
11 1 (0.37%) Kusto Query Language
11 1 (0.37%) R
11 1 (0.37%) T-SQL
11 1 (0.37%) VB.NET
Qualifications
1 60 (22.14%) Degree
1 60 (22.14%) HNC
2 16 (5.90%) ITIL Foundation Certificate
3 14 (5.17%) Computer Science Degree
4 8 (2.95%) ITIL Certification
5 5 (1.85%) AWS Certification
6 4 (1.48%) SC Cleared
6 4 (1.48%) Security Cleared
7 3 (1.11%) Microsoft Certification
8 2 (0.74%) ACCA
8 2 (0.74%) CIMA
8 2 (0.74%) CIPD
8 2 (0.74%) Master's Degree
8 2 (0.74%) MBA
8 2 (0.74%) PMP
9 1 (0.37%) AWS Certified Cloud Practitioner
9 1 (0.37%) Azure Certification
9 1 (0.37%) CISA
9 1 (0.37%) ISO 27001 Lead Auditor
9 1 (0.37%) PMI Certification
Quality Assurance & Compliance
1 7 (2.58%) PMO
2 6 (2.21%) IEC 61131
3 5 (1.85%) GDPR
4 4 (1.48%) Cyber Essentials
4 4 (1.48%) ISO 9001
4 4 (1.48%) ISO/IEC 27001
4 4 (1.48%) P3O
5 3 (1.11%) Accessibility
5 3 (1.11%) Data Quality
5 3 (1.11%) GRC
5 3 (1.11%) NIST
5 3 (1.11%) QA
5 3 (1.11%) SLA
6 2 (0.74%) Actionable Recommendations
7 1 (0.37%) California Consumer Privacy Act
7 1 (0.37%) GMP
7 1 (0.37%) ISO/IEC 12207
7 1 (0.37%) ISO/IEC 15288
7 1 (0.37%) PCI DSS
7 1 (0.37%) SOC 2
System Software
1 14 (5.17%) Docker
2 7 (2.58%) Active Directory
3 1 (0.37%) Hyper-V
3 1 (0.37%) Virtual Servers
3 1 (0.37%) VMware ESXi
3 1 (0.37%) VMware Infrastructure
Systems Management
1 11 (4.06%) Ansible
1 11 (4.06%) Terraform
2 8 (2.95%) Kubernetes
2 8 (2.95%) Microsoft Intune
3 2 (0.74%) Control-M
3 2 (0.74%) HP Fortify
3 2 (0.74%) Prometheus
4 1 (0.37%) Argo
4 1 (0.37%) Grafana
4 1 (0.37%) QRadar
4 1 (0.37%) SCOM
4 1 (0.37%) vCenter Server
Vendors
1 60 (22.14%) Rockwell
1 60 (22.14%) Siemens
2 34 (12.55%) Microsoft
3 17 (6.27%) SAP
4 16 (5.90%) Atlassian
5 7 (2.58%) Salesforce
5 7 (2.58%) ServiceNow
6 6 (2.21%) Sophos
7 4 (1.48%) Ariba
7 4 (1.48%) Autodesk
7 4 (1.48%) IBM
7 4 (1.48%) Sage
8 3 (1.11%) Oracle
9 2 (0.74%) Concur
9 2 (0.74%) Google
9 2 (0.74%) Nexthink
9 2 (0.74%) Qualtrics
9 2 (0.74%) Splunk
10 1 (0.37%) Databricks
10 1 (0.37%) Instagram