Roadmaps Jobs in Yorkshire

Roadmaps
England > Yorkshire

The following table provides summary statistics for permanent job vacancies advertised in Yorkshire with a requirement for Roadmaps skills. Included is a benchmarking guide to the salaries offered in vacancies that have cited Roadmaps over the 6 months to 2 December 2023 with a comparison to the same period in the previous 2 years.

6 months to
2 Dec 2023
Same period 2022 Same period 2021
Rank 30 25 26
Rank change year-on-year -5 +1 +13
Permanent jobs citing Roadmaps 272 679 553
As % of all permanent jobs advertised in Yorkshire 8.52% 9.69% 8.02%
As % of the Processes & Methodologies category 8.95% 10.05% 8.41%
Number of salaries quoted 171 354 424
10th Percentile £50,000 £43,750 £38,575
25th Percentile £57,500 £56,219 £44,750
Median annual salary (50th Percentile) £72,500 £69,447 £55,000
Median % change year-on-year +4.40% +26.27% -4.35%
75th Percentile £84,528 £84,577 £75,000
90th Percentile £95,000 £97,448 £90,000
England median annual salary £75,000 £72,500 £70,000
% change year-on-year +3.45% +3.57% +7.69%

All Process and Methodology Skills
Yorkshire

Roadmaps is in the Processes and Methodologies category. The following table is for comparison with the above and provides summary statistics for all permanent job vacancies advertised in Yorkshire with a requirement for process or methodology skills.

Permanent vacancies with a requirement for process or methodology skills 3,040 6,757 6,575
As % of all permanent jobs advertised in Yorkshire 95.24% 96.45% 95.39%
Number of salaries quoted 2,137 3,763 4,915
10th Percentile £29,000 £30,829 £31,250
25th Percentile £39,750 £41,250 £38,750
Median annual salary (50th Percentile) £52,500 £53,000 £50,000
Median % change year-on-year -0.94% +6.00% +5.26%
75th Percentile £67,500 £71,250 £65,000
90th Percentile £84,056 £85,000 £78,250
England median annual salary £60,000 £62,500 £60,000
% change year-on-year -4.00% +4.17% +9.09%

Roadmaps
Job Vacancy Trend in Yorkshire

Job postings citing Roadmaps as a proportion of all IT jobs advertised in Yorkshire.
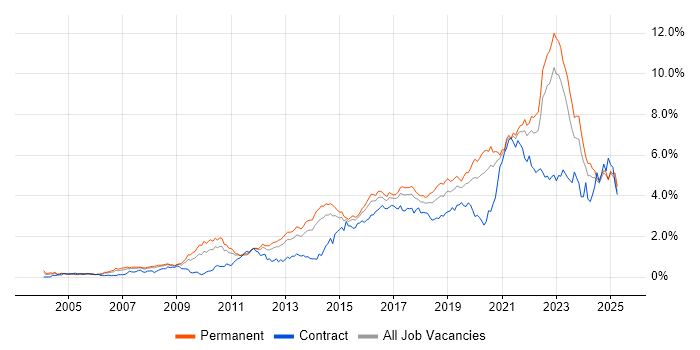
Job vacancy trend for Roadmaps in Yorkshire

Roadmaps
Salary Trend in Yorkshire

3-month moving average salary quoted in jobs citing Roadmaps in Yorkshire.

Salary trend for Roadmaps in Yorkshire

Roadmaps
Salary Histogram in Yorkshire

Salary distribution for jobs citing Roadmaps in Yorkshire over the 6 months to 2 December 2023.

Salary histogram for Roadmaps in Yorkshire

Roadmaps
Job Locations in Yorkshire

The table below looks at the demand and provides a guide to the median salaries quoted in IT jobs citing Roadmaps within the Yorkshire region over the 6 months to 2 December 2023. The 'Rank Change' column provides an indication of the change in demand within each location based on the same 6 month period last year.

Location Rank Change
on Same Period
Last Year
Matching
Permanent
IT Job Ads
Median Salary
Past 6 Months
Median Salary
% Change
on Same Period
Last Year
Live
Jobs
West Yorkshire -5 222 £77,500 +11.60% 45
South Yorkshire -5 26 £60,000 -1.64% 19
North Yorkshire +33 17 £59,500 -14.02% 14
East Yorkshire +1 5 £50,000 - 4
Roadmaps
England

Roadmaps
Co-occurring Skills and Capabilities in Yorkshire by Category

The follow tables expand on the table above by listing co-occurrences grouped by category. The same employment type, locality and period is covered with up to 20 co-occurrences shown in each of the following categories:

Application Platforms
1 4 (1.47%) Oracle SOA Suite
2 2 (0.74%) SharePoint
3 1 (0.37%) CMS
3 1 (0.37%) OpenEdge
Applications
1 4 (1.47%) Chatbot
2 1 (0.37%) Microsoft Project
2 1 (0.37%) MS Visio
2 1 (0.37%) Trello
Business Applications
1 19 (6.99%) Dynamics CRM
2 4 (1.47%) Unit4 Business World
3 1 (0.37%) SAP HR
3 1 (0.37%) Sparx Enterprise Architect
Cloud Services
1 85 (31.25%) Azure
2 68 (25.00%) PaaS
3 55 (20.22%) SaaS
4 51 (18.75%) IaaS
5 49 (18.01%) GCP
6 44 (16.18%) AWS
7 28 (10.29%) Power Platform
8 25 (9.19%) Serverless
9 23 (8.46%) Azure Functions
10 21 (7.72%) Dynamics 365
11 13 (4.78%) Azure DevOps
12 11 (4.04%) Microsoft 365
13 6 (2.21%) Amazon S3
13 6 (2.21%) GitHub
14 4 (1.47%) Amazon CloudWatch
14 4 (1.47%) AWS CodePipeline
14 4 (1.47%) Azure ExpressRoute
14 4 (1.47%) Azure Sentinel
14 4 (1.47%) Azure Stack
14 4 (1.47%) SuccessFactors
Communications & Networking
1 12 (4.41%) Firewall
2 6 (2.21%) DNS
2 6 (2.21%) WAN
3 5 (1.84%) Network Security
3 5 (1.84%) Unified Communications
4 4 (1.47%) Internet
4 4 (1.47%) LAN
5 3 (1.10%) DHCP
5 3 (1.10%) TCP/IP
5 3 (1.10%) Wi-Fi
6 2 (0.74%) Ethernet VPN
6 2 (0.74%) MPLS
6 2 (0.74%) SD-WAN
6 2 (0.74%) VXLAN
7 1 (0.37%) Reverse Proxy
7 1 (0.37%) SAN
7 1 (0.37%) VLAN
7 1 (0.37%) VPN
Database & Business Intelligence
1 29 (10.66%) Data Lake
1 29 (10.66%) Data Warehouse
1 29 (10.66%) NoSQL
2 11 (4.04%) SQL Server
3 8 (2.94%) Power BI
4 6 (2.21%) Amazon Athena
4 6 (2.21%) Amazon QuickSight
4 6 (2.21%) Amazon RDS
4 6 (2.21%) Amazon Redshift
4 6 (2.21%) BusinessObjects
4 6 (2.21%) DynamoDB
5 4 (1.47%) Relational Database
6 2 (0.74%) BigQuery
7 1 (0.37%) Azure SQL Database
7 1 (0.37%) Metadata
7 1 (0.37%) QualityStage
7 1 (0.37%) SAP HANA
Development Applications
1 10 (3.68%) Git
2 8 (2.94%) JIRA
3 6 (2.21%) Jenkins
4 2 (0.74%) Oracle Forms
5 1 (0.37%) Artifactory
5 1 (0.37%) Bitbucket
5 1 (0.37%) ERwin
5 1 (0.37%) SonarQube
5 1 (0.37%) Visual Studio Code
General
1 146 (53.68%) Finance
2 77 (28.31%) Banking
3 40 (14.71%) Retail
4 39 (14.34%) Social Skills
5 15 (5.51%) Analytical Skills
6 14 (5.15%) Marketing
7 12 (4.41%) Inclusion and Diversity
8 11 (4.04%) Law
9 9 (3.31%) Influencing Skills
10 7 (2.57%) Legal
11 6 (2.21%) Games
12 5 (1.84%) Manufacturing
12 5 (1.84%) Organisational Skills
12 5 (1.84%) Public Sector
12 5 (1.84%) Tech for Good
13 4 (1.47%) Billing
14 3 (1.10%) Local Government
15 2 (0.74%) Presentation Skills
16 1 (0.37%) Back Office
16 1 (0.37%) Financial Institution
Job Titles
1 128 (47.06%) Architect
2 69 (25.37%) Enterprise Architect
3 32 (11.76%) Lead
4 28 (10.29%) Solutions Architect
5 24 (8.82%) Commercial Architect
5 24 (8.82%) Senior
6 18 (6.62%) CRM Architect
6 18 (6.62%) Dynamics 365 Architect
6 18 (6.62%) Dynamics CRM Architect
7 14 (5.15%) Product Manager
7 14 (5.15%) Product Owner
8 13 (4.78%) Developer
9 11 (4.04%) Cloud Engineer
10 10 (3.68%) Security Architect
11 9 (3.31%) Cloud Security Engineer
11 9 (3.31%) Security Engineer
12 8 (2.94%) Data Architect
12 8 (2.94%) Digital Architect
12 8 (2.94%) Digital Solutions Architect
12 8 (2.94%) Security Solutions Architect
Libraries, Frameworks & Software Standards
1 37 (13.60%) OpenID
2 16 (5.88%) .NET
3 13 (4.78%) Kafka
4 11 (4.04%) JWT
4 11 (4.04%) REST
4 11 (4.04%) Web Services
5 8 (2.94%) OAuth
6 6 (2.21%) CSS
6 6 (2.21%) HTML
7 5 (1.84%) .NET Core
7 5 (1.84%) Node.js
7 5 (1.84%) React
8 4 (1.47%) ARM Templates
8 4 (1.47%) Azure Blueprints
8 4 (1.47%) jQuery
8 4 (1.47%) JSON
8 4 (1.47%) Oracle Fusion
8 4 (1.47%) YAML
9 2 (0.74%) AngularJS
9 2 (0.74%) ASP.NET MVC
Miscellaneous
1 32 (11.76%) Product Ownership
2 29 (10.66%) Blockchain
2 29 (10.66%) Mainframe
3 28 (10.29%) Public Cloud
4 21 (7.72%) Cloud Native
5 9 (3.31%) Enterprise Software
6 8 (2.94%) Data Centre
6 8 (2.94%) Renewable Energy
7 5 (1.84%) Virtual Team
8 4 (1.47%) Digital Signage
8 4 (1.47%) Linux Command Line
8 4 (1.47%) Private Cloud
8 4 (1.47%) Video Conferencing
9 3 (1.10%) Legacy Systems
9 3 (1.10%) Management Information System
10 2 (0.74%) Blog
10 2 (0.74%) Greenfield Project
10 2 (0.74%) Self-Motivation
11 1 (0.37%) Data Structures
11 1 (0.37%) IoT
Operating Systems
1 29 (10.66%) Unix
2 8 (2.94%) Windows
3 5 (1.84%) Linux
4 2 (0.74%) Windows Server
5 1 (0.37%) Android
5 1 (0.37%) Apple iOS
5 1 (0.37%) Ubuntu
Processes & Methodologies
1 184 (67.65%) Agile
2 75 (27.57%) Enterprise Architecture
3 73 (26.84%) Strategic Roadmap
4 45 (16.54%) Customer Service
4 45 (16.54%) Cybersecurity
5 43 (15.81%) Thought Leadership
6 42 (15.44%) Analytics
7 41 (15.07%) DevOps
8 40 (14.71%) Microservices
9 39 (14.34%) Technology Strategy
10 38 (13.97%) Technology Roadmap
11 37 (13.60%) Zero Trust
12 36 (13.24%) Machine Learning
12 36 (13.24%) Product Roadmap
13 33 (12.13%) Artificial Intelligence
13 33 (12.13%) IT Strategy
13 33 (12.13%) SOA
14 31 (11.40%) Problem-Solving
15 29 (10.66%) CI/CD
15 29 (10.66%) Risk Management
Programming Languages
1 23 (8.46%) SQL
2 22 (8.09%) Python
3 14 (5.15%) C#
4 12 (4.41%) JavaScript
5 11 (4.04%) PowerShell
6 9 (3.31%) Bash
7 8 (2.94%) Java
8 4 (1.47%) Bicep
9 3 (1.10%) C++
10 2 (0.74%) Data Analysis Expressions
10 2 (0.74%) Rust
10 2 (0.74%) TypeScript
11 1 (0.37%) Delphi
11 1 (0.37%) PHP
11 1 (0.37%) Shell Script
Qualifications
1 17 (6.25%) Degree
2 8 (2.94%) Azure Certification
2 8 (2.94%) CISMP
3 3 (1.10%) ITIL Certification
3 3 (1.10%) MCP
3 3 (1.10%) Network+ Certification
3 3 (1.10%) OCP
3 3 (1.10%) Oracle Certification
4 2 (0.74%) CCIE
4 2 (0.74%) Cisco Certification
4 2 (0.74%) JNCIE
4 2 (0.74%) PMI Certification
4 2 (0.74%) PMP
4 2 (0.74%) SC Cleared
4 2 (0.74%) Security Cleared
4 2 (0.74%) TOGAF Certification
5 1 (0.37%) AWS Certification
5 1 (0.37%) CISSP
5 1 (0.37%) Microsoft Certification
5 1 (0.37%) Numerate Degree
Quality Assurance & Compliance
1 14 (5.15%) GRC
2 8 (2.94%) Data Quality
3 6 (2.21%) PMO
4 3 (1.10%) QA
5 1 (0.37%) GDPR
5 1 (0.37%) P3O
5 1 (0.37%) SLA
System Software
1 7 (2.57%) Docker
2 5 (1.84%) Firmware
3 4 (1.47%) Virtual Machines
4 3 (1.10%) VMware Infrastructure
5 2 (0.74%) Active Directory
5 2 (0.74%) Virtual Desktop
5 2 (0.74%) VMware ESXi
6 1 (0.37%) Hyper-V
Systems Management
1 32 (11.76%) Kubernetes
2 9 (3.31%) Terraform
3 4 (1.47%) Istio
4 3 (1.10%) Microsoft Intune
Vendors
1 39 (14.34%) Microsoft
2 14 (5.15%) SAP
3 12 (4.41%) Google
3 12 (4.41%) Salesforce
4 8 (2.94%) Oracle
5 7 (2.57%) Cisco
6 4 (1.47%) ServiceNow
7 3 (1.10%) VMware
8 2 (0.74%) Ahrefs
8 2 (0.74%) DeepCrawl
8 2 (0.74%) Dell
8 2 (0.74%) GoldenSource
8 2 (0.74%) HP
8 2 (0.74%) Screaming Frog
9 1 (0.37%) BiZZdesign
9 1 (0.37%) Fortinet
9 1 (0.37%) MuleSoft
9 1 (0.37%) Salesforce Marketing Cloud
9 1 (0.37%) Sparx
9 1 (0.37%) Workday