CI/CD Jobs in Yorkshire

CI/CD
England > Yorkshire

The table below provides summary statistics for permanent job vacancies advertised in Yorkshire requiring CI/CD skills. It includes a benchmarking guide to the annual salaries offered in vacancies that cited CI/CD over the 6 months leading up to 30 April 2025, comparing them to the same period in the previous two years.

6 months to
30 Apr 2025
Same period 2024 Same period 2023
Rank 38 63 35
Rank change year-on-year +25 -28 -5
Permanent jobs citing CI/CD 157 198 666
As % of all permanent jobs advertised in Yorkshire 5.87% 3.44% 8.07%
As % of the Processes & Methodologies category 6.25% 4.10% 8.24%
Number of salaries quoted 105 167 323
10th Percentile £48,250 £46,250 £41,250
25th Percentile £56,250 £48,750 £49,750
Median annual salary (50th Percentile) £68,000 £65,000 £65,000
Median % change year-on-year +4.62% - -
75th Percentile £93,750 £78,750 £79,000
90th Percentile £140,677 £87,710 £97,328
England median annual salary £75,000 £70,000 £75,000
% change year-on-year +7.14% -6.67% -

All Process and Methodology Skills
Yorkshire

CI/CD falls under the Processes and Methodologies category. For comparison with the information above, the following table provides summary statistics for all permanent job vacancies requiring process or methodology skills in Yorkshire.

Permanent vacancies with a requirement for process or methodology skills 2,513 4,834 8,085
As % of all permanent jobs advertised in Yorkshire 94.01% 83.89% 97.98%
Number of salaries quoted 1,336 3,700 3,509
10th Percentile £25,750 £27,500 £31,250
25th Percentile £32,250 £36,250 £40,000
Median annual salary (50th Percentile) £47,683 £50,000 £55,000
Median % change year-on-year -4.63% -9.09% +7.84%
75th Percentile £70,000 £65,000 £70,000
90th Percentile £87,500 £80,000 £83,750
England median annual salary £57,500 £55,000 £62,500
% change year-on-year +4.55% -12.00% +4.17%

CI/CD
Job Vacancy Trend in Yorkshire

Job postings citing CI/CD as a proportion of all IT jobs advertised in Yorkshire.
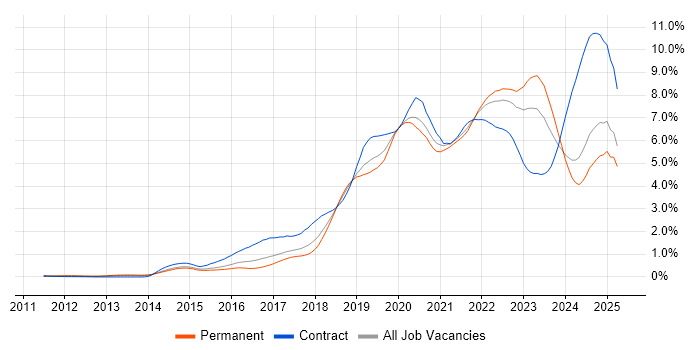
Job vacancy trend for CI/CD in Yorkshire

CI/CD
Salary Trend in Yorkshire

3-month moving average salary quoted in jobs citing CI/CD in Yorkshire.

Salary trend for CI/CD in Yorkshire

CI/CD
Salary Histogram in Yorkshire

Salary distribution for jobs citing CI/CD in Yorkshire over the 6 months to 30 April 2025.

Salary histogram for CI/CD in Yorkshire

CI/CD
Job Locations in Yorkshire

The table below looks at the demand and provides a guide to the median salaries quoted in IT jobs citing CI/CD within the Yorkshire region over the 6 months to 30 April 2025. The 'Rank Change' column provides an indication of the change in demand within each location based on the same 6 month period last year.

Location Rank Change
on Same Period
Last Year
Matching
Permanent
IT Job Ads
Median Salary
Past 6 Months
Median Salary
% Change
on Same Period
Last Year
Live
Jobs
West Yorkshire +23 118 £76,250 +17.31% 85
South Yorkshire +44 24 £62,500 - 26
North Yorkshire -6 5 £61,500 +11.82% 13
Humberside - 2 £58,000 -
East Yorkshire -4 1 £35,000 -41.67%
CI/CD
England

CI/CD
Co-occurring Skills and Capabilities in Yorkshire by Category

The follow tables expand on the table above by listing co-occurrences grouped by category. The same employment type, locality and period is covered with up to 20 co-occurrences shown in each of the following categories:

Application Platforms
1 17 (10.83%) Confluence
2 7 (4.46%) SAS
3 3 (1.91%) nginx
4 2 (1.27%) IIS
4 2 (1.27%) OpenStack
4 2 (1.27%) Tomcat
4 2 (1.27%) WebSphere
4 2 (1.27%) WebSphere Application Server
5 1 (0.64%) Apache
5 1 (0.64%) Apache Spark
5 1 (0.64%) Oracle SOA Suite
5 1 (0.64%) Oracle Workflow
5 1 (0.64%) SharePoint
5 1 (0.64%) WebLogic
5 1 (0.64%) WordPress
Applications
1 1 (0.64%) Microsoft Office
1 1 (0.64%) Microsoft PowerPoint
1 1 (0.64%) Microsoft Project
1 1 (0.64%) MS Visio
Business Applications
1 3 (1.91%) Payment Gateway
2 2 (1.27%) Oracle BPM
3 1 (0.64%) Sparx Enterprise Architect
Cloud Services
1 71 (45.22%) Azure
2 53 (33.76%) AWS
3 51 (32.48%) GCP
4 31 (19.75%) GitHub
5 17 (10.83%) Azure DevOps
6 13 (8.28%) Serverless
7 11 (7.01%) SaaS
8 10 (6.37%) GitHub Actions
9 9 (5.73%) Power Platform
10 8 (5.10%) AWS Lambda
11 7 (4.46%) Amazon S3
11 7 (4.46%) Azure Cosmos DB
12 6 (3.82%) AWS CloudFormation
12 6 (3.82%) Azure Synapse Analytics
13 5 (3.18%) AWS Step Functions
13 5 (3.18%) IaaS
13 5 (3.18%) PaaS
13 5 (3.18%) Snowflake
14 4 (2.55%) Azure Data Factory
14 4 (2.55%) Google Kubernetes Engine
Communications & Networking
1 3 (1.91%) Firewall
1 3 (1.91%) VPN
2 2 (1.27%) Cisco Nexus
2 2 (1.27%) FCoE
2 2 (1.27%) Fibre Channel
2 2 (1.27%) iSCSI
2 2 (1.27%) LAN
2 2 (1.27%) Multicast
2 2 (1.27%) NAS
2 2 (1.27%) SAN
2 2 (1.27%) TCP/IP
2 2 (1.27%) WAN
3 1 (0.64%) Broadband
3 1 (0.64%) DHCP
3 1 (0.64%) DNS
3 1 (0.64%) HTTPS
3 1 (0.64%) Internet
3 1 (0.64%) Network Security
3 1 (0.64%) WPA
Database & Business Intelligence
1 25 (15.92%) NoSQL
2 17 (10.83%) SQL Server
3 12 (7.64%) PostgreSQL
4 10 (6.37%) MongoDB
4 10 (6.37%) MySQL
5 7 (4.46%) Power BI
6 5 (3.18%) Amazon Redshift
6 5 (3.18%) Data Warehouse
6 5 (3.18%) Redis
6 5 (3.18%) SQL Server Integration Services
6 5 (3.18%) SQL Server Reporting Services
7 4 (2.55%) BigQuery
7 4 (2.55%) Biml
7 4 (2.55%) DynamoDB
7 4 (2.55%) SQL Server Analysis Services
8 2 (1.27%) Amazon Athena
8 2 (1.27%) Big Data
8 2 (1.27%) Oracle Database
8 2 (1.27%) Oracle Database 12c
8 2 (1.27%) Relational Database
Development Applications
1 32 (20.38%) Jenkins
2 25 (15.92%) Git
3 21 (13.38%) JIRA
4 17 (10.83%) GitLab
5 9 (5.73%) CircleCI
6 8 (5.10%) Selenium
7 7 (4.46%) Sonatype Nexus
8 6 (3.82%) JUnit
8 6 (3.82%) Maven
8 6 (3.82%) Oracle Forms
8 6 (3.82%) SonarQube
9 4 (2.55%) Visual Studio
10 2 (1.27%) Gradle
10 2 (1.27%) JDeveloper
10 2 (1.27%) Mocha
11 1 (0.64%) Artifactory
11 1 (0.64%) Cucumber
11 1 (0.64%) JMeter
11 1 (0.64%) Spinnaker
11 1 (0.64%) TestNG
General
1 57 (36.31%) Social Skills
2 49 (31.21%) Finance
3 43 (27.39%) Banking
4 12 (7.64%) Public Sector
5 8 (5.10%) Inclusion and Diversity
6 7 (4.46%) Organisational Skills
7 5 (3.18%) Marketing
7 5 (3.18%) Retail
8 4 (2.55%) Analytical Skills
9 3 (1.91%) Legal
10 2 (1.27%) Tech for Good
11 1 (0.64%) Advertising
11 1 (0.64%) Back Office
11 1 (0.64%) Billing
11 1 (0.64%) Cantonese Language
11 1 (0.64%) Influencing Skills
11 1 (0.64%) Publishing
11 1 (0.64%) Telecoms
Job Titles
1 67 (42.68%) Senior
2 37 (23.57%) Developer
3 35 (22.29%) Lead
3 35 (22.29%) Software Engineer
4 21 (13.38%) Senior Software Engineer
5 18 (11.46%) Senior Developer
6 13 (8.28%) Architect
6 13 (8.28%) DevOps Engineer
7 10 (6.37%) Engineering Manager
7 10 (6.37%) Senior Manager
8 9 (5.73%) Solutions Architect
9 8 (5.10%) .NET Developer
9 8 (5.10%) Full-Stack Developer
9 8 (5.10%) Software Engineering Manager
9 8 (5.10%) Software Manager
10 7 (4.46%) Data Engineer
10 7 (4.46%) Enterprise Management Architect
10 7 (4.46%) Enterprise Solutions Architect
10 7 (4.46%) Lead Software Engineer
10 7 (4.46%) Lead Solutions Architect
Libraries, Frameworks & Software Standards
1 42 (26.75%) .NET
2 36 (22.93%) React
3 21 (13.38%) AngularJS
4 18 (11.46%) Node.js
5 17 (10.83%) .NET Core
6 15 (9.55%) Kafka
6 15 (9.55%) Spring Boot
7 13 (8.28%) RESTful
8 12 (7.64%) Spring
9 11 (7.01%) .NET Framework
9 11 (7.01%) REST
9 11 (7.01%) Vue
10 10 (6.37%) ASP.NET
11 8 (5.10%) Express.js
11 8 (5.10%) JWT
11 8 (5.10%) OAuth
11 8 (5.10%) OAuth2
11 8 (5.10%) SailPoint
11 8 (5.10%) SOAP
12 7 (4.46%) Middleware
Miscellaneous
1 26 (16.56%) Distributed Systems
2 15 (9.55%) Product Ownership
3 12 (7.64%) Public Cloud
4 11 (7.01%) Cloud Native
5 9 (5.73%) Private Cloud
6 8 (5.10%) Credit Risk
6 8 (5.10%) Market Risk
7 7 (4.46%) Management Information System
8 5 (3.18%) CMDB
8 5 (3.18%) Mobile App
8 5 (3.18%) Virtual Team
9 4 (2.55%) Greenfield Project
10 3 (1.91%) Cyber Security Posture
10 3 (1.91%) Security Posture
11 2 (1.27%) Clustering
11 2 (1.27%) Data Centre
11 2 (1.27%) Enterprise Cloud
11 2 (1.27%) Legacy Systems
11 2 (1.27%) Replication
12 1 (0.64%) Taxonomies
Operating Systems
1 15 (9.55%) Linux
2 8 (5.10%) Unix
3 7 (4.46%) Windows
4 2 (1.27%) Solaris
5 1 (0.64%) Android
5 1 (0.64%) Apple iOS
5 1 (0.64%) Windows Server
Processes & Methodologies
1 94 (59.87%) DevOps
2 77 (49.04%) Agile
3 67 (42.68%) Software Engineering
4 50 (31.85%) Mentoring
5 49 (31.21%) Containerisation
6 38 (24.20%) Microservices
7 37 (23.57%) Test Automation
8 36 (22.93%) Continuous Improvement
9 35 (22.29%) Infrastructure as Code
10 32 (20.38%) Coaching
11 28 (17.83%) Problem-Solving
12 26 (16.56%) Continuous Integration
13 23 (14.65%) Roadmaps
14 20 (12.74%) Continuous Delivery
15 18 (11.46%) Analytics
15 18 (11.46%) ETL
16 17 (10.83%) Stakeholder Management
17 16 (10.19%) Collaborative Working
17 16 (10.19%) Scrum
18 15 (9.55%) SDLC
Programming Languages
1 51 (32.48%) JavaScript
2 50 (31.85%) Python
3 49 (31.21%) SQL
4 48 (30.57%) Java
5 43 (27.39%) C#
6 23 (14.65%) TypeScript
7 12 (7.64%) PowerShell
8 8 (5.10%) Bash
9 7 (4.46%) Go
9 7 (4.46%) R
10 6 (3.82%) PL/SQL
10 6 (3.82%) T-SQL
11 4 (2.55%) Rust
12 3 (1.91%) Bicep
12 3 (1.91%) Groovy
13 2 (1.27%) C++
13 2 (1.27%) Shell Script
14 1 (0.64%) ActionScript
14 1 (0.64%) Perl
14 1 (0.64%) XPath
Qualifications
1 12 (7.64%) SC Cleared
1 12 (7.64%) Security Cleared
2 8 (5.10%) Degree
3 6 (3.82%) Azure Certification
4 5 (3.18%) AWS Certification
5 3 (1.91%) Microsoft Certification
6 1 (0.64%) AWS Certified Solutions Architect
6 1 (0.64%) Computer Science Degree
6 1 (0.64%) MCSD
Quality Assurance & Compliance
1 13 (8.28%) GDPR
2 9 (5.73%) PCI DSS
3 8 (5.10%) Basel III
3 8 (5.10%) IFRS
3 8 (5.10%) IFRS 9
4 7 (4.46%) Basel II
4 7 (4.46%) Dodd-Frank
4 7 (4.46%) QA
5 4 (2.55%) ISO/IEC 27001
6 3 (1.91%) Accessibility
6 3 (1.91%) NIST
7 1 (0.64%) Data Quality
System Software
1 54 (34.39%) Docker
2 5 (3.18%) Active Directory
3 3 (1.91%) VMware Infrastructure
4 2 (1.27%) Hyper-V
4 2 (1.27%) KVM
4 2 (1.27%) NFS
4 2 (1.27%) SRDF
4 2 (1.27%) Veritas Cluster Server
4 2 (1.27%) Xen
5 1 (0.64%) Squid
5 1 (0.64%) Virtual Machines
5 1 (0.64%) vSphere
Systems Management
1 56 (35.67%) Kubernetes
2 30 (19.11%) Terraform
3 22 (14.01%) Ansible
4 4 (2.55%) Istio
5 3 (1.91%) HAProxy
5 3 (1.91%) Prometheus
6 2 (1.27%) Puppet
6 2 (1.27%) SCCM
7 1 (0.64%) Grafana
7 1 (0.64%) Kibana
7 1 (0.64%) Packer
Vendors
1 18 (11.46%) Microsoft
2 15 (9.55%) Oracle
3 8 (5.10%) Databricks
4 6 (3.82%) VMware
5 5 (3.18%) ServiceNow
6 4 (2.55%) Cisco
6 4 (2.55%) Google
6 4 (2.55%) IBM
7 3 (1.91%) Splunk
8 2 (1.27%) AppDynamics
8 2 (1.27%) BMC
8 2 (1.27%) Broadcom
8 2 (1.27%) CyberSource
8 2 (1.27%) EMC
8 2 (1.27%) F5
8 2 (1.27%) HP
8 2 (1.27%) NetApp
8 2 (1.27%) New Relic
8 2 (1.27%) Red Hat
9 1 (0.64%) Dynatrace