JavaScript Jobs in England

JavaScript (including ECMAScript)
UK > England

The table below provides summary statistics for permanent job vacancies advertised in England requiring JavaScript skills. It includes a benchmarking guide to the annual salaries offered in vacancies that cited JavaScript over the 6 months leading up to 26 July 2024, comparing them to the same period in the previous two years.

6 months to
26 Jul 2024
Same period 2023 Same period 2022
Rank 18 19 12
Rank change year-on-year +1 -7 -5
Permanent jobs citing JavaScript 6,050 6,670 23,869
As % of all permanent jobs advertised in England 7.72% 9.38% 16.23%
As % of the Programming Languages category 25.95% 23.28% 31.65%
Number of salaries quoted 4,668 5,646 11,262
10th Percentile £35,000 £40,000 £37,500
25th Percentile £45,000 £48,750 £45,000
Median annual salary (50th Percentile) £60,000 £65,000 £60,000
Median % change year-on-year -7.69% +8.33% +9.09%
75th Percentile £85,000 £83,750 £81,250
90th Percentile £122,500 £107,500 £97,500
UK median annual salary £60,000 £62,845 £60,000
% change year-on-year -4.53% +4.74% +9.09%

All Programming Languages
England

JavaScript falls under the Programming Languages category. For comparison with the information above, the following table provides summary statistics for all permanent job vacancies requiring coding skills in England.

Permanent vacancies with a requirement for coding skills 23,314 28,657 75,412
As % of all permanent jobs advertised in England 29.75% 40.31% 51.29%
Number of salaries quoted 17,627 21,657 38,997
10th Percentile £36,250 £40,000 £37,500
25th Percentile £45,500 £50,000 £46,250
Median annual salary (50th Percentile) £60,000 £65,000 £62,500
Median % change year-on-year -7.69% +4.00% +8.70%
75th Percentile £82,500 £86,250 £85,000
90th Percentile £102,500 £110,000 £101,250
UK median annual salary £60,000 £65,000 £62,500
% change year-on-year -7.69% +4.00% +8.70%

JavaScript
Job Vacancy Trend in England

Job postings citing JavaScript as a proportion of all IT jobs advertised in England.
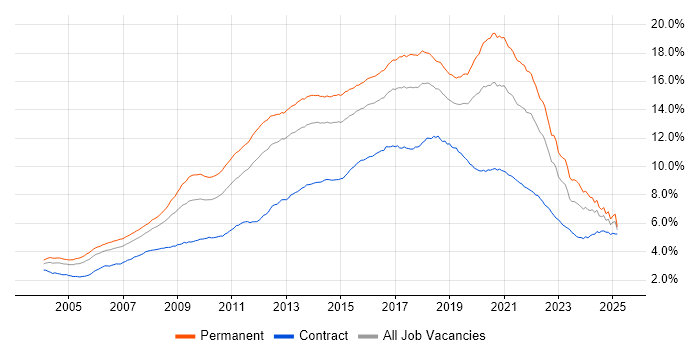
Job vacancy trend for JavaScript in England

JavaScript
Salary Trend in England

3-month moving average salary quoted in jobs citing JavaScript in England.

Salary trend for JavaScript in England

JavaScript
Salary Histogram in England

Salary distribution for jobs citing JavaScript in England over the 6 months to 26 July 2024.

Salary histogram for JavaScript in England

JavaScript
Job Locations in England

The table below looks at the demand and provides a guide to the median salaries quoted in IT jobs citing JavaScript within the England region over the 6 months to 26 July 2024. The 'Rank Change' column provides an indication of the change in demand within each location based on the same 6 month period last year.

Location Rank Change
on Same Period
Last Year
Matching
Permanent
IT Job Ads
Median Salary
Past 6 Months
Median Salary
% Change
on Same Period
Last Year
Live
Jobs
London -2 1,954 £90,000 +20.00% 215
North of England +4 1,186 £55,000 - 162
South East -3 1,173 £55,000 -8.33% 167
Midlands +18 753 £50,000 -9.09% 118
North West +4 691 £55,000 - 86
South West +7 604 £54,750 -0.45% 89
West Midlands +6 394 £50,000 -9.09% 77
Yorkshire +11 391 £55,000 - 55
East Midlands +10 351 £47,500 -18.10% 41
East of England +23 324 £52,500 -4.55% 83
North East +7 104 £60,000 +9.09% 23
JavaScript
UK

JavaScript
Co-occurring Skills and Capabilities in England by Category

The follow tables expand on the table above by listing co-occurrences grouped by category. The same employment type, locality and period is covered with up to 20 co-occurrences shown in each of the following categories:

Application Platforms
1 616 (10.18%) Apache
2 605 (10.00%) Apache Airflow
3 215 (3.55%) CMS
4 176 (2.91%) WordPress
5 142 (2.35%) ArcGIS
6 129 (2.13%) GeoServer
7 106 (1.75%) IIS
8 92 (1.52%) nginx
9 80 (1.32%) SharePoint
10 67 (1.11%) Umbraco
11 61 (1.01%) Confluence
12 39 (0.64%) Headless CMS
13 37 (0.61%) Apache Spark
14 36 (0.60%) Camunda
15 32 (0.53%) Drupal
15 32 (0.53%) Sitecore CMS
16 29 (0.48%) Kentico
17 25 (0.41%) Microsoft Exchange
18 18 (0.30%) NServiceBus
19 16 (0.26%) Moodle
Applications
1 57 (0.94%) Microsoft Office
2 47 (0.78%) Microsoft Excel
3 44 (0.73%) Adobe XD
4 43 (0.71%) Simulink
5 33 (0.55%) Photoshop
6 19 (0.31%) Sketch
7 14 (0.23%) Adobe Illustrator
8 11 (0.18%) Chatbot
8 11 (0.18%) Microsoft PowerPoint
9 10 (0.17%) Trello
10 9 (0.15%) Adobe Creative Suite
11 7 (0.12%) InVision
11 7 (0.12%) Spreadsheet
12 6 (0.099%) MadCap Flare
12 6 (0.099%) RoboHelp
13 3 (0.050%) MS Visio
13 3 (0.050%) SPSS
14 2 (0.033%) Adobe After Effects
14 2 (0.033%) Notion
15 1 (0.017%) Zeplin
Business Applications
1 105 (1.74%) Dynamics CRM
2 46 (0.76%) Magento
3 38 (0.63%) Shopify
4 37 (0.61%) SDL Web 8
5 30 (0.50%) Ripple
6 18 (0.30%) Remedy ITSM
7 15 (0.25%) Payment Gateway
8 14 (0.23%) Salesforce CRM
9 13 (0.21%) Adobe Campaign
10 10 (0.17%) Fidessa
11 9 (0.15%) Sage 200
12 7 (0.12%) NetSuite
12 7 (0.12%) SAP ERP
13 6 (0.099%) Oracle Cash Management
13 6 (0.099%) SAP SD
14 4 (0.066%) CiviCRM
14 4 (0.066%) Dynamics NAV
15 2 (0.033%) Oracle EBS
15 2 (0.033%) SAP GRC
15 2 (0.033%) SAP MII
Cloud Services
1 2,119 (35.02%) Azure
2 2,021 (33.40%) AWS
3 604 (9.98%) GCP
4 560 (9.26%) dbt
5 545 (9.01%) Snowflake
6 509 (8.41%) Azure DevOps
7 374 (6.18%) Serverless
8 302 (4.99%) Power Platform
9 300 (4.96%) IBM Cloud
10 289 (4.78%) SaaS
11 225 (3.72%) GitHub
12 190 (3.14%) Azure Service Bus
13 178 (2.94%) Dynamics 365
14 174 (2.88%) Azure Logic Apps
15 168 (2.78%) Azure Functions
16 151 (2.50%) Power Automate
17 149 (2.46%) Amazon EKS
18 147 (2.43%) PowerApps
19 133 (2.20%) Azure API Management
20 126 (2.08%) Amazon ECS
Communications & Networking
1 89 (1.47%) Internet
2 49 (0.81%) HTTP
3 39 (0.64%) DNS
4 36 (0.60%) AMQP
5 29 (0.48%) Wireless
6 28 (0.46%) TCP/IP
7 25 (0.41%) MQTT
8 20 (0.33%) Wi-Fi
9 19 (0.31%) Firewall
10 18 (0.30%) DHCP
11 17 (0.28%) RS-485
12 16 (0.26%) Network Security
13 15 (0.25%) VPN
14 13 (0.21%) 3G
14 13 (0.21%) 4G
14 13 (0.21%) SSL
15 10 (0.17%) FIX Connectivity
16 9 (0.15%) VoIP
17 6 (0.099%) Intranet
18 5 (0.083%) SSH
Database & Business Intelligence
1 934 (15.44%) SQL Server
2 606 (10.02%) PostgreSQL
3 561 (9.27%) Amazon Athena
4 558 (9.22%) Apache Arrow
4 558 (9.22%) Dremio
5 533 (8.81%) Data Lake
6 529 (8.74%) Apache Ignite
7 509 (8.41%) MySQL
8 485 (8.02%) NoSQL
9 454 (7.50%) MongoDB
10 319 (5.27%) Relational Database
11 248 (4.10%) DB2
12 170 (2.81%) GIS
13 148 (2.45%) Power BI
14 129 (2.13%) QGIS
15 115 (1.90%) Elasticsearch
16 103 (1.70%) Big Data
17 61 (1.01%) Azure SQL Database
18 59 (0.98%) Oracle Database
18 59 (0.98%) SQL Server Reporting Services
Development Applications
1 944 (15.60%) Git
2 260 (4.30%) JIRA
3 167 (2.76%) Visual Studio
4 154 (2.55%) Jenkins
5 146 (2.41%) Selenium
6 145 (2.40%) Cypress.io
7 130 (2.15%) GitLab
8 91 (1.50%) TeamCity
9 63 (1.04%) NUnit
10 61 (1.01%) Moq
11 55 (0.91%) webpack
12 52 (0.86%) Team Foundation Server
13 46 (0.76%) Jasmine
14 45 (0.74%) Octopus Deploy
15 39 (0.64%) Bitbucket
15 39 (0.64%) SpecFlow
16 36 (0.60%) Visual Studio Code
17 34 (0.56%) Postman
18 33 (0.55%) SonarQube
18 33 (0.55%) Vagrant
General
1 1,222 (20.20%) Finance
2 1,147 (18.96%) Social Skills
3 651 (10.76%) Banking
4 649 (10.73%) Front Office
5 522 (8.63%) Investment Banking
6 458 (7.57%) Public Sector
7 367 (6.07%) Marketing
8 325 (5.37%) Inclusion and Diversity
9 319 (5.27%) Analytical Skills
10 179 (2.96%) Law
11 167 (2.76%) Retail
12 139 (2.30%) Games
13 138 (2.28%) Legal
14 82 (1.36%) Manufacturing
15 63 (1.04%) Advertising
16 61 (1.01%) Aerospace
17 60 (0.99%) Automotive
17 60 (0.99%) Tech for Good
18 56 (0.93%) Financial Institution
18 56 (0.93%) Telecoms
Job Titles
1 3,563 (58.89%) Developer
2 1,374 (22.71%) Senior
3 1,165 (19.26%) Software Engineer
4 843 (13.93%) .NET Developer
5 767 (12.68%) Senior Developer
6 720 (11.90%) Full Stack Developer
7 600 (9.92%) Lead
8 512 (8.46%) Software Developer
9 456 (7.54%) C# Developer
10 439 (7.26%) Senior Software Engineer
11 355 (5.87%) PHP Developer
12 309 (5.11%) AWS Engineer
13 304 (5.02%) C# .NET Developer
14 282 (4.66%) Lead Developer
15 280 (4.63%) Front-End Developer (Client-Side Developer)
16 279 (4.61%) Full Stack Engineer
17 269 (4.45%) Architect
18 268 (4.43%) Python Engineer
19 254 (4.20%) Developer/Software Engineer
20 248 (4.10%) Python Software Engineer
Libraries, Frameworks & Software Standards
1 2,501 (41.34%) HTML
2 2,453 (40.55%) CSS
3 2,296 (37.95%) React
4 2,262 (37.39%) .NET
5 1,448 (23.93%) AngularJS
6 1,004 (16.60%) ASP.NET
7 921 (15.22%) Node.js
8 852 (14.08%) Vue
9 746 (12.33%) .NET Core
10 682 (11.27%) REST
11 664 (10.98%) jQuery
12 651 (10.76%) gRPC
13 615 (10.17%) Web Services
14 603 (9.97%) Protocol Buffers
15 582 (9.62%) HTML5
16 577 (9.54%) RESTful
17 548 (9.06%) .NET Framework
18 513 (8.48%) Pandas
19 510 (8.43%) NumPy
20 508 (8.40%) Twitter Bootstrap
Miscellaneous
1 619 (10.23%) Fixed Income
2 615 (10.17%) Hedge funds
3 578 (9.55%) Foreign Exchange (FX)
4 571 (9.44%) Derivative
5 562 (9.29%) Equities
6 346 (5.72%) Blockchain
7 313 (5.17%) Algorithms
8 303 (5.01%) Hybrid Cloud
9 298 (4.93%) Data Structures
10 240 (3.97%) Greenfield Project
11 219 (3.62%) Product Ownership
12 181 (2.99%) Mobile App
13 174 (2.88%) e-Learning
14 164 (2.71%) Self-Motivation
15 160 (2.64%) Cloud Native
16 90 (1.49%) IoT
17 74 (1.22%) Distributed Systems
18 72 (1.19%) Pricing Data
19 63 (1.04%) Legacy Systems
20 59 (0.98%) Low-Code
Operating Systems
1 663 (10.96%) Linux
2 455 (7.52%) Windows
3 381 (6.30%) Android
4 316 (5.22%) Apple iOS
5 87 (1.44%) Ubuntu
6 79 (1.31%) CentOS
7 69 (1.14%) Red Hat Enterprise Linux
8 36 (0.60%) Unix
9 31 (0.51%) Debian
10 22 (0.36%) Windows Server
11 19 (0.31%) Embedded Linux
12 12 (0.20%) VMS
13 10 (0.17%) Solaris
14 5 (0.083%) AIX
14 5 (0.083%) Alpine Linux
15 4 (0.066%) Kali Linux
16 2 (0.033%) Rocky
17 1 (0.017%) Mac OS
17 1 (0.017%) Windows 7
17 1 (0.017%) Windows Server 2012
Processes & Methodologies
1 2,692 (44.50%) Agile
2 1,841 (30.43%) Full Stack Development
3 1,813 (29.97%) Software Engineering
4 1,221 (20.18%) DevOps
5 969 (16.02%) Web Development
6 952 (15.74%) Problem-Solving
7 943 (15.59%) MVC
8 762 (12.60%) Asset Management
9 759 (12.55%) User Experience
10 718 (11.87%) Computer Science
11 675 (11.16%) Artificial Intelligence
12 607 (10.03%) OO
13 577 (9.54%) Mentoring
14 561 (9.27%) Front End Development
15 557 (9.21%) Microservices
16 528 (8.73%) CI/CD
17 511 (8.45%) Investment Management
18 503 (8.31%) OOP
19 499 (8.25%) Scrum
20 464 (7.67%) TDD
Programming Languages
1 2,408 (39.80%) C#
2 1,788 (29.55%) Python
3 1,785 (29.50%) TypeScript
4 1,645 (27.19%) SQL
5 1,492 (24.66%) Java
6 733 (12.12%) PHP
7 200 (3.31%) C++
8 196 (3.24%) T-SQL
9 133 (2.20%) Go
10 108 (1.79%) C
11 100 (1.65%) VB.NET
12 95 (1.57%) PowerShell
13 94 (1.55%) Ruby
14 72 (1.19%) Kotlin
15 64 (1.06%) VB
16 57 (0.94%) Bash
17 55 (0.91%) Rust
18 36 (0.60%) Lua
19 35 (0.58%) Apex Code
20 32 (0.53%) Solidity
Qualifications
1 985 (16.28%) Degree
2 498 (8.23%) Security Cleared
3 395 (6.53%) Computer Science Degree
4 351 (5.80%) SC Cleared
5 123 (2.03%) DV Cleared
6 93 (1.54%) Master's Degree
7 39 (0.64%) Microsoft Certification
8 31 (0.51%) Azure Certification
9 19 (0.31%) AWS Certification
10 16 (0.26%) ISTQB
11 14 (0.23%) PhD
12 12 (0.20%) ITIL Certification
13 11 (0.18%) Numerate Degree
14 8 (0.13%) DBS Check
15 7 (0.12%) BPSS Clearance
15 7 (0.12%) Postgraduate
16 6 (0.099%) HND
16 6 (0.099%) OSCP
17 5 (0.083%) CREST Certified
17 5 (0.083%) PCI QSA
Quality Assurance & Compliance
1 313 (5.17%) QA
2 188 (3.11%) Data Quality
3 145 (2.40%) Accessibility
4 50 (0.83%) WCAG
5 47 (0.78%) GDPR
6 37 (0.61%) SLA
7 24 (0.40%) ISO/IEC 27001
8 10 (0.17%) Cyber Essentials
8 10 (0.17%) GRC
9 8 (0.13%) ISO 13485
10 7 (0.12%) PCI DSS
11 6 (0.099%) IEC 61131
12 5 (0.083%) HIPAA
12 5 (0.083%) PMO
13 4 (0.066%) EMIR
13 4 (0.066%) MiFID
14 3 (0.050%) ISO 9001
14 3 (0.050%) Software Quality Assurance
15 2 (0.033%) HL7
15 2 (0.033%) ISO 9000
System Software
1 605 (10.00%) Docker
2 24 (0.40%) Active Directory
3 12 (0.20%) Virtual Machines
4 11 (0.18%) VMware Infrastructure
5 9 (0.15%) Hyper-V
6 8 (0.13%) Virtual Desktop
7 7 (0.12%) Firmware
8 5 (0.083%) VMware ESXi
9 3 (0.050%) KVM
9 3 (0.050%) vSphere
10 2 (0.033%) Embedded Firmware
10 2 (0.033%) VMware Server
11 1 (0.017%) Dovecot
11 1 (0.017%) GlusterFS
11 1 (0.017%) OpenAM
11 1 (0.017%) OpenDJ
11 1 (0.017%) Postfix
11 1 (0.017%) Varnish
Systems Management
1 512 (8.46%) Kubernetes
2 257 (4.25%) Terraform
3 117 (1.93%) Ansible
4 64 (1.06%) Prometheus
5 41 (0.68%) Puppet
6 34 (0.56%) Single Sign-On
7 26 (0.43%) Grafana
8 22 (0.36%) Progress Chef
9 13 (0.21%) Kibana
10 12 (0.20%) Active Directory Federation Services
11 10 (0.17%) MIIS
12 8 (0.13%) Rancher
13 7 (0.12%) Nagios
14 5 (0.083%) CloudHub
14 5 (0.083%) cPanel
14 5 (0.083%) Plesk
15 4 (0.066%) HP Quality Center
15 4 (0.066%) Istio
15 4 (0.066%) Nmap
16 3 (0.050%) Docker Swarm
Vendors
1 762 (12.60%) Microsoft
2 349 (5.77%) Red Hat
3 303 (5.01%) IBM
4 201 (3.32%) Google
5 155 (2.56%) Oracle
6 141 (2.33%) ESRI
7 136 (2.25%) Adobe
8 87 (1.44%) ServiceNow
9 77 (1.27%) Bloomberg
10 74 (1.22%) Salesforce
11 70 (1.16%) Reuters
12 46 (0.76%) Atlassian
13 39 (0.64%) Facebook
14 37 (0.61%) SAP
14 37 (0.61%) Sitecore
15 34 (0.56%) Optimizely
16 32 (0.53%) Xilinx
17 29 (0.48%) SaltStack
18 27 (0.45%) HP
19 24 (0.40%) Remedy