Instagram
UK
The table below provides summary statistics for contract job vacancies with a requirement for knowledge and experience of Instagram products and/or services. Included is a benchmarking guide to the contractor rates offered in vacancies that have cited Instagram over the 6 months to 27 April 2024 with a comparison to the same period in the previous 2 years.
The figures below represent the IT contractor job market in general and are not representative of contractor rates within Instagram.
| 6 months to 27 Apr 2024 |
Same period 2023 | Same period 2022 | |
|---|---|---|---|
| Rank | 564 | 694 | 816 |
| Rank change year-on-year | +130 | +122 | -147 |
| Contract jobs citing Instagram | 34 | 25 | 33 |
| As % of all contract jobs advertised in the UK | 0.079% | 0.042% | 0.037% |
| As % of the Vendors category | 0.18% | 0.097% | 0.093% |
| Number of daily rates quoted | 24 | 19 | 31 |
| 10th Percentile | £245 | £185 | £138 |
| 25th Percentile | £325 | £231 | £169 |
| Median daily rate (50th Percentile) | £450 | £263 | £225 |
| Median % change year-on-year | +71.43% | +16.67% | +20.00% |
| 75th Percentile | £475 | £400 | £341 |
| 90th Percentile | £545 | £543 | £475 |
| UK excluding London median daily rate | £450 | £250 | £190 |
| % change year-on-year | +80.00% | +31.58% | -11.63% |
| Number of hourly rates quoted | 4 | 1 | 0 |
| 10th Percentile | - | - | - |
| 25th Percentile | £34.25 | £38.75 | - |
| Median hourly rate | £36.50 | £42.50 | - |
| Median % change year-on-year | -14.12% | - | - |
| 75th Percentile | £40.00 | £46.25 | - |
| 90th Percentile | £42.25 | - | - |
| UK excluding London median hourly rate | - | £42.50 | - |
All Vendors
UK
Instagram is in the Vendor Products and Services category. The following table is for comparison with the above and provides summary statistics for all contract job vacancies with a requirement for knowledge or experience of vendor products and services.
| Contract vacancies with a requirement for knowledge or experience of vendor products and services | 18,438 | 25,649 | 35,406 |
| As % of all contract IT jobs advertised in the UK | 42.58% | 42.89% | 39.86% |
| Number of daily rates quoted | 11,419 | 17,207 | 23,532 |
| 10th Percentile | £263 | £270 | £290 |
| 25th Percentile | £403 | £413 | £413 |
| Median daily rate (50th Percentile) | £518 | £525 | £525 |
| Median % change year-on-year | -1.43% | - | +10.53% |
| 75th Percentile | £627 | £650 | £631 |
| 90th Percentile | £738 | £743 | £725 |
| UK excluding London median daily rate | £500 | £500 | £463 |
| % change year-on-year | - | +8.11% | +8.82% |
| Number of hourly rates quoted | 1,097 | 699 | 889 |
| 10th Percentile | £12.08 | £15.25 | £11.50 |
| 25th Percentile | £14.48 | £19.06 | £15.00 |
| Median hourly rate | £22.00 | £43.75 | £21.00 |
| Median % change year-on-year | -49.71% | +108.33% | -6.67% |
| 75th Percentile | £56.49 | £65.00 | £46.12 |
| 90th Percentile | £70.00 | £75.75 | £60.00 |
| UK excluding London median hourly rate | £21.46 | £38.50 | £18.69 |
| % change year-on-year | -44.26% | +105.96% | -0.44% |
Instagram
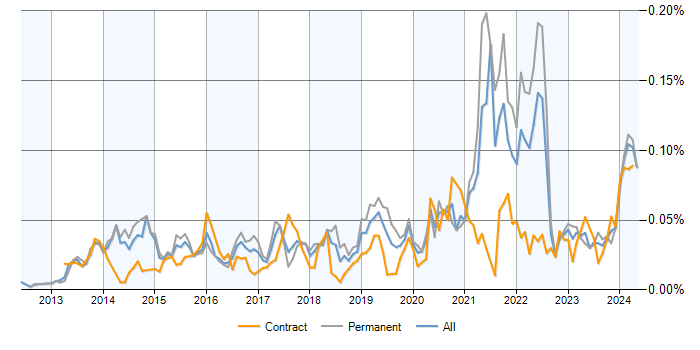
Job Vacancy Trend
Job postings citing Instagram as a proportion of all IT jobs advertised.

Instagram
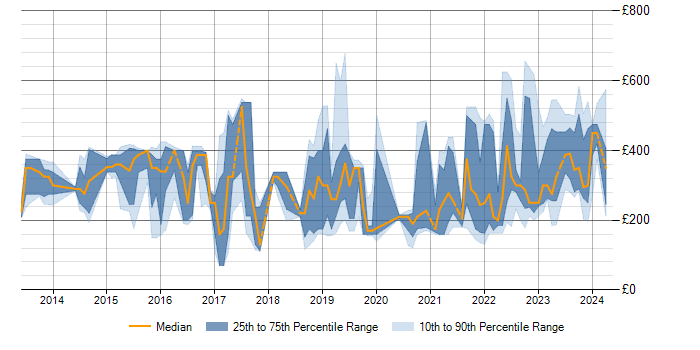
Contractor Daily Rate Trend
3-month moving average daily rate quoted in jobs citing Instagram.

Instagram
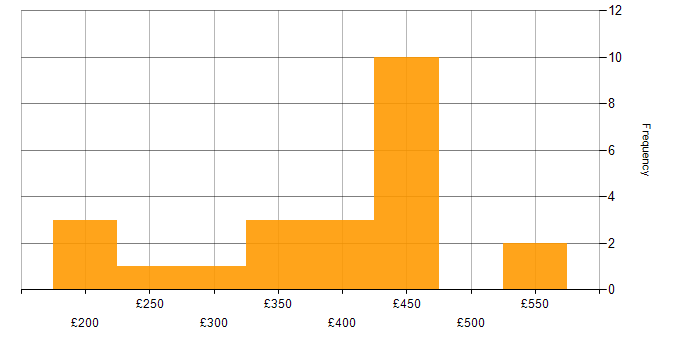
Daily Rate Histogram
Daily rate distribution for jobs citing Instagram over the 6 months to 27 April 2024.

Instagram
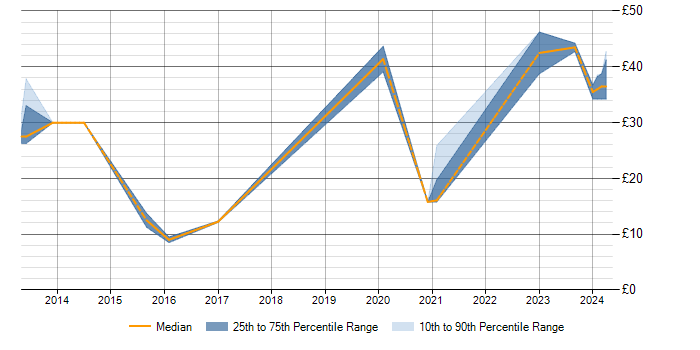
Contractor Hourly Rate Trend
3-month moving average hourly rates quoted in jobs citing Instagram.

Instagram
Top 10 Contract Locations
The table below looks at the demand and provides a guide to the median contractor rates quoted in IT jobs citing Instagram within the UK over the 6 months to 27 April 2024. The 'Rank Change' column provides an indication of the change in demand within each location based on the same 6 month period last year.
| Location | Rank Change on Same Period Last Year |
Matching Contract IT Job Ads |
Median Daily Rate Past 6 Months |
Median Daily Rate % Change on Same Period Last Year |
Live Jobs |
|---|---|---|---|---|---|
| England | +137 | 30 | £450 | +63.64% | 106 |
| Work from Home | +135 | 17 | £450 | +63.64% | 52 |
| London | +103 | 15 | £450 | +63.64% | 38 |
| UK excluding London | +64 | 11 | £450 | +80.00% | 72 |
| South East | - | 4 | £450 | - | 20 |
| North of England | +34 | 3 | £450 | +33.33% | 25 |
| West Midlands | +31 | 3 | £450 | +227.27% | 6 |
| Midlands | +24 | 3 | £450 | +227.27% | 14 |
| North West | +18 | 3 | £450 | - | 24 |
| Scotland | +31 | 1 | - | - | 4 |
Instagram
Co-occurring Skills and Capabilities by Category
The follow tables expand on the table above by listing co-occurrences grouped by category. The same employment type, locality and period is covered with up to 20 co-occurrences shown in each of the following categories:
