Site Reliability Engineering Jobs

Site Reliability Engineering (SRE)
UK

The table below provides summary statistics for permanent job vacancies requiring Site Reliability Engineering skills. It includes a benchmarking guide to the annual salaries offered in vacancies that cited Site Reliability Engineering over the 6 months leading up to 2 July 2025, comparing them to the same period in the previous two years.

6 months to
2 Jul 2025
Same period 2024 Same period 2023
Rank 340 336 399
Rank change year-on-year -4 +63 -98
Permanent jobs citing Site Reliability Engineering 455 851 715
As % of all permanent jobs advertised in the UK 0.78% 0.79% 0.80%
As % of the Processes & Methodologies category 0.85% 0.96% 0.84%
Number of salaries quoted 205 367 535
10th Percentile £57,425 £57,000 £49,550
25th Percentile £63,750 £62,500 £61,180
Median annual salary (50th Percentile) £80,000 £80,000 £80,000
Median % change year-on-year - - +6.67%
75th Percentile £115,000 £103,750 £100,000
90th Percentile £127,500 £125,000 £115,000
UK excluding London median annual salary £67,500 £66,500 £67,500
% change year-on-year +1.50% -1.48% -6.90%

All Process and Methodology Skills
UK

Site Reliability Engineering falls under the Processes and Methodologies category. For comparison with the information above, the following table provides summary statistics for all permanent job vacancies requiring process or methodology skills.

Permanent vacancies with a requirement for process or methodology skills 53,298 89,106 85,068
As % of all permanent jobs advertised in the UK 91.19% 82.51% 95.34%
Number of salaries quoted 27,465 61,429 52,805
10th Percentile £27,336 £29,750 £33,750
25th Percentile £38,500 £40,000 £45,000
Median annual salary (50th Percentile) £55,000 £55,000 £60,331
Median % change year-on-year - -8.84% +0.55%
75th Percentile £75,000 £72,500 £80,000
90th Percentile £96,250 £92,500 £100,000
UK excluding London median annual salary £50,000 £50,000 £55,000
% change year-on-year - -9.09% +4.76%

Site Reliability Engineering
Job Vacancy Trend

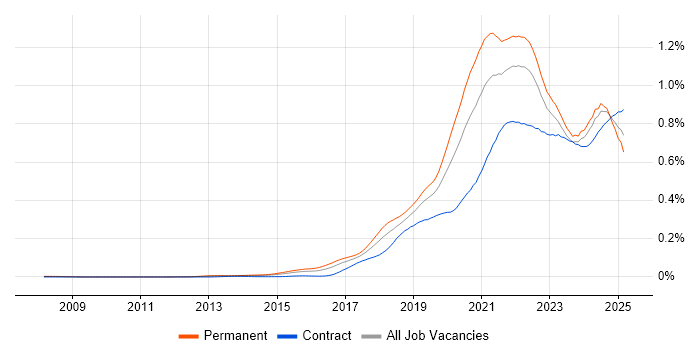
Job postings citing Site Reliability Engineering as a proportion of all IT jobs advertised.

Job vacancy trend for Site Reliability Engineering in the UK

Site Reliability Engineering
Salary Trend

3-month moving average salary quoted in jobs citing Site Reliability Engineering.

Salary trend for Site Reliability Engineering in the UK

Site Reliability Engineering
Salary Histogram

Salary distribution for jobs citing Site Reliability Engineering over the 6 months to 2 July 2025.

Salary histogram for Site Reliability Engineering in the UK

Site Reliability Engineering
Top 17 Job Locations

The table below looks at the demand and provides a guide to the median salaries quoted in IT jobs citing Site Reliability Engineering within the UK over the 6 months to 2 July 2025. The 'Rank Change' column provides an indication of the change in demand within each location based on the same 6 month period last year.

Location Rank Change
on Same Period
Last Year
Matching
Permanent
IT Job Ads
Median Salary
Past 6 Months
Median Salary
% Change
on Same Period
Last Year
Live
Jobs
England +7 423 £82,500 +3.13% 1,264
Work from Home +172 304 £91,000 +10.30% 560
UK excluding London -18 289 £67,500 +1.50% 651
North of England -5 210 £69,384 +10.51% 178
North West -13 193 £67,037 +6.78% 107
London +44 145 £110,000 +4.76% 696
Scotland -27 23 £67,500 -15.63% 68
Midlands +53 22 £67,500 +12.50% 64
West Midlands +66 21 £67,500 -18.18% 44
Yorkshire +25 14 £72,500 +15.48% 57
South West +69 13 £57,500 -28.13% 80
East of England +31 9 £65,000 -0.94% 76
South East +51 7 £75,000 +9.89% 157
Wales +45 4 £47,617 -16.32% 10
North East +28 3 £69,384 +10.51% 14
Northern Ireland +44 1 - - 21
East Midlands +28 1 £45,000 -18.18% 20

Site Reliability Engineering
Co-occurring Skills and Capabilities by Category

The follow tables expand on the table above by listing co-occurrences grouped by category. The same employment type, locality and period is covered with up to 20 co-occurrences shown in each of the following categories:

Application Platforms
1 43 (9.45%) Apache Airflow
2 42 (9.23%) Apache
2 42 (9.23%) Apache Spark
3 5 (1.10%) Apache Solr
4 4 (0.88%) nginx
5 3 (0.66%) CMS
6 2 (0.44%) Confluence
7 1 (0.22%) CICS
7 1 (0.22%) Microsoft Exchange
7 1 (0.22%) OpenStack
7 1 (0.22%) Oracle Workflow
7 1 (0.22%) SharePoint
7 1 (0.22%) WebSphere
Applications
1 1 (0.22%) Microsoft Office
1 1 (0.22%) PlantUML
Business Applications
1 1 (0.22%) Dynamics CRM
Cloud Services
1 359 (78.90%) AWS
2 284 (62.42%) Azure
3 244 (53.63%) GCP
4 76 (16.70%) Amazon ECS
5 61 (13.41%) Serverless
6 55 (12.09%) OpenShift
7 52 (11.43%) dbt
8 49 (10.77%) AWS Lambda
9 26 (5.71%) AWS CloudFormation
10 25 (5.49%) Pulumi
11 23 (5.05%) Datadog
12 15 (3.30%) Azure DevOps
12 15 (3.30%) Azure Monitor
12 15 (3.30%) GitHub
13 14 (3.08%) Amazon CloudWatch
14 13 (2.86%) Cloud Computing
15 12 (2.64%) Amazon EKS
15 12 (2.64%) Amazon OpenSearch
16 10 (2.20%) GitHub Actions
16 10 (2.20%) Sentry
Communications & Networking
1 14 (3.08%) TCP/IP
2 7 (1.54%) DNS
2 7 (1.54%) NAS
2 7 (1.54%) SAN
3 6 (1.32%) Firewall
4 3 (0.66%) Network Security
4 3 (0.66%) WAN
5 2 (0.44%) DHCP
5 2 (0.44%) HTTPS
5 2 (0.44%) IPsec
5 2 (0.44%) SNA
5 2 (0.44%) SNMP
5 2 (0.44%) SSH
5 2 (0.44%) Wireshark
6 1 (0.22%) BGP
6 1 (0.22%) Internet
6 1 (0.22%) Multicast
6 1 (0.22%) OpenVPN
6 1 (0.22%) Unified Communications
6 1 (0.22%) VLAN
Database & Business Intelligence
1 42 (9.23%) Amazon Athena
1 42 (9.23%) Apache Arrow
1 42 (9.23%) Apache Iceberg
1 42 (9.23%) Apache Ignite
1 42 (9.23%) Dremio
2 25 (5.49%) Elasticsearch
3 20 (4.40%) PostgreSQL
4 16 (3.52%) MongoDB
5 15 (3.30%) Amazon RDS
6 11 (2.42%) Redis
7 9 (1.98%) NoSQL
8 7 (1.54%) MySQL
9 3 (0.66%) Couchbase
9 3 (0.66%) DB2
9 3 (0.66%) SQL Server
10 2 (0.44%) Azure SQL Database
10 2 (0.44%) BigQuery
10 2 (0.44%) Data Lake
10 2 (0.44%) Data Warehouse
10 2 (0.44%) HDInsight
Development Applications
1 43 (9.45%) Artifactory
2 42 (9.23%) Jenkins
3 35 (7.69%) GitLab
4 14 (3.08%) Git
4 14 (3.08%) JIRA
5 5 (1.10%) Sonatype Nexus
6 4 (0.88%) Bitbucket
6 4 (0.88%) Octopus Deploy
6 4 (0.88%) Vite
7 2 (0.44%) TeamCity
8 1 (0.22%) CircleCI
8 1 (0.22%) Jaeger
8 1 (0.22%) Subversion
8 1 (0.22%) Vagrant
General
1 211 (46.37%) Inclusion and Diversity
2 129 (28.35%) Finance
3 63 (13.85%) Social Skills
4 44 (9.67%) Front Office
5 33 (7.25%) Banking
6 29 (6.37%) Law
7 18 (3.96%) Manufacturing
8 17 (3.74%) Marketing
9 11 (2.42%) Analytical Skills
10 6 (1.32%) Electronics
10 6 (1.32%) Public Sector
10 6 (1.32%) Telecoms
11 4 (0.88%) Games
11 4 (0.88%) Investment Banking
12 3 (0.66%) Retail
13 2 (0.44%) Advertising
14 1 (0.22%) Billing
14 1 (0.22%) Documentation Skills
14 1 (0.22%) Influencing Skills
14 1 (0.22%) Military
Job Titles
1 221 (48.57%) Senior
2 206 (45.27%) Software Engineer
3 180 (39.56%) Senior Software Engineer
4 96 (21.10%) Site Reliability Engineer
5 77 (16.92%) DevOps Engineer
6 70 (15.38%) Site Engineer
7 55 (12.09%) AWS Engineer
8 53 (11.65%) AWS DevOps
9 52 (11.43%) AWS DevOps Engineer
10 50 (10.99%) Lead
11 46 (10.11%) Python Engineer
12 42 (9.23%) Data Engineer
13 16 (3.52%) Cloud Engineer
14 14 (3.08%) Azure Engineer
14 14 (3.08%) Platform Engineer
15 10 (2.20%) Java Engineer
15 10 (2.20%) Kubernetes Engineer
16 9 (1.98%) Senior DevOps
16 9 (1.98%) Senior DevOps Engineer
16 9 (1.98%) Technical Leader
Libraries, Frameworks & Software Standards
1 216 (47.47%) .NET
2 190 (41.76%) Node.js
3 58 (12.75%) Kafka
4 42 (9.23%) J2EE
4 42 (9.23%) PySpark
5 24 (5.27%) Loki
6 12 (2.64%) OpenTelemetry
7 11 (2.42%) Spring
8 10 (2.20%) Django
9 9 (1.98%) React
9 9 (1.98%) REST
10 7 (1.54%) Spring Boot
11 5 (1.10%) ARM Templates
11 5 (1.10%) FastAPI
12 4 (0.88%) Elastic Stack
12 4 (0.88%) Jest
13 3 (0.66%) JPA
13 3 (0.66%) OAuth
13 3 (0.66%) OAuth2
13 3 (0.66%) OpenID
Miscellaneous
1 182 (40.00%) Self-Motivation
2 178 (39.12%) Cyberattack
2 178 (39.12%) Linux Command Line
3 25 (5.49%) Cloud Native
4 23 (5.05%) Product Ownership
4 23 (5.05%) Public Cloud
5 11 (2.42%) Distributed Systems
6 7 (1.54%) Hybrid Cloud
7 6 (1.32%) Algorithms
7 6 (1.32%) Data Centre
7 6 (1.32%) Greenfield Project
8 5 (1.10%) Data Structures
9 4 (0.88%) Mobile App
10 3 (0.66%) Mainframe
10 3 (0.66%) Security Posture
11 2 (0.44%) Data Protection Act
11 2 (0.44%) Enterprise Cloud
11 2 (0.44%) Legacy Systems
11 2 (0.44%) Robotics
12 1 (0.22%) Credit Risk
Operating Systems
1 218 (47.91%) Linux
2 16 (3.52%) Windows
3 14 (3.08%) Unix
4 9 (1.98%) Windows Server
5 6 (1.32%) Red Hat Enterprise Linux
6 5 (1.10%) Ubuntu
7 3 (0.66%) Android
8 2 (0.44%) CentOS
8 2 (0.44%) VMS
8 2 (0.44%) zOS
9 1 (0.22%) Debian
9 1 (0.22%) SUSE
Processes & Methodologies
1 295 (64.84%) Agile
2 272 (59.78%) Software Engineering
3 235 (51.65%) Data Engineering
4 211 (46.37%) Mentoring
5 198 (43.52%) Microservices
6 193 (42.42%) Machine Learning
7 188 (41.32%) DevOps
8 186 (40.88%) Cloud Security
8 186 (40.88%) Scrum
9 183 (40.22%) User Experience
10 161 (35.38%) CI/CD
11 75 (16.48%) Observability
12 74 (16.26%) Infrastructure as Code
13 62 (13.63%) Open Source
14 57 (12.53%) Containerisation
15 48 (10.55%) Problem-Solving
16 43 (9.45%) Asset Management
17 34 (7.47%) Service-Level Objective
18 32 (7.03%) Artificial Intelligence
19 31 (6.81%) Stakeholder Management
Programming Languages
1 327 (71.87%) Python
2 274 (60.22%) Java
3 253 (55.60%) Go
4 193 (42.42%) JavaScript
5 182 (40.00%) Rust
6 180 (39.56%) C++
7 46 (10.11%) Bash
8 37 (8.13%) PowerShell
9 25 (5.49%) TypeScript
10 24 (5.27%) C#
11 21 (4.62%) SQL
12 10 (2.20%) Bicep
13 6 (1.32%) Ruby
14 5 (1.10%) Kusto Query Language
14 5 (1.10%) Shell Script
15 3 (0.66%) Gremlin
16 2 (0.44%) Clojure
16 2 (0.44%) Elixir
16 2 (0.44%) JCL
16 2 (0.44%) Scala
Qualifications
1 206 (45.27%) Security Cleared
2 190 (41.76%) AWS Certification
3 185 (40.66%) DV Cleared
4 180 (39.56%) AWS Certified Solutions Architect
5 178 (39.12%) AWS Certified Developer
6 23 (5.05%) Degree
7 19 (4.18%) SC Cleared
8 14 (3.08%) Computer Science Degree
9 8 (1.76%) Azure Certification
10 2 (0.44%) (ISC)2 CCSP
10 2 (0.44%) CCSP
10 2 (0.44%) Cisco Certification
10 2 (0.44%) CISSP
11 1 (0.22%) CEH
11 1 (0.22%) CISA
11 1 (0.22%) CISM
11 1 (0.22%) CompTIA Security+
11 1 (0.22%) CRISC
11 1 (0.22%) FFIEC
11 1 (0.22%) PMI Certification
Quality Assurance & Compliance
1 11 (2.42%) QA
2 8 (1.76%) PCI DSS
3 7 (1.54%) ISO/IEC 27001
4 4 (0.88%) Sarbanes-Oxley
5 3 (0.66%) Accessibility
5 3 (0.66%) SLA
6 2 (0.44%) GDPR
6 2 (0.44%) NIST
6 2 (0.44%) SOC 2
7 1 (0.22%) COBIT
7 1 (0.22%) NIST 800
7 1 (0.22%) PMO
System Software
1 124 (27.25%) Docker
2 6 (1.32%) Virtual Machines
3 5 (1.10%) Active Directory
3 5 (1.10%) VMware Infrastructure
4 3 (0.66%) Hyper-V
5 2 (0.44%) Squid
6 1 (0.22%) Firmware
6 1 (0.22%) HDFS
6 1 (0.22%) RACF
6 1 (0.22%) VMware NSX
6 1 (0.22%) vSphere
Systems Management
1 171 (37.58%) Kubernetes
2 159 (34.95%) Terraform
3 73 (16.04%) Grafana
4 64 (14.07%) Prometheus
5 36 (7.91%) Ansible
6 17 (3.74%) Progress Chef
7 11 (2.42%) Puppet
8 9 (1.98%) AWS Copilot
9 8 (1.76%) Istio
10 6 (1.32%) Argo
10 6 (1.32%) Podman
11 5 (1.10%) ITRS Geneos
12 4 (0.88%) Kibana
13 3 (0.66%) Single Sign-On
14 2 (0.44%) HAProxy
14 2 (0.44%) linkerd
14 2 (0.44%) logstash
14 2 (0.44%) Rancher
14 2 (0.44%) Tivoli NetView
15 1 (0.22%) Oracle Enterprise Manager
Vendors
1 23 (5.05%) Oracle
1 23 (5.05%) Splunk
2 22 (4.84%) Google
3 17 (3.74%) Dynatrace
4 15 (3.30%) Microsoft
5 11 (2.42%) VMware
6 10 (2.20%) Red Hat
6 10 (2.20%) SAP
7 8 (1.76%) Hitachi
8 6 (1.32%) Confluent
9 5 (1.10%) ServiceNow
10 4 (0.88%) IBM
10 4 (0.88%) New Relic
11 3 (0.66%) AppDynamics
11 3 (0.66%) ForgeRock
11 3 (0.66%) Ping Identity
11 3 (0.66%) Sybase
12 2 (0.44%) Broadcom
12 2 (0.44%) PagerDuty
12 2 (0.44%) Salesforce