Public Sector Contracts in the North West

Public Sector
England > North West

The table below looks at the prevalence of the term Public Sector in contract job vacancies in the North West. Included is a benchmarking guide to the contractor rates offered in vacancies that cited Public Sector over the 6 months leading up to 17 May 2025, comparing them to the same period in the previous two years.

6 months to
17 May 2025
Same period 2024 Same period 2023
Rank 15 8 6
Rank change year-on-year -7 -2 +5
Contract jobs citing Public Sector 191 312 484
As % of all contract jobs advertised in the North West 9.71% 11.70% 15.77%
As % of the General category 16.84% 21.82% 29.95%
Number of daily rates quoted 130 207 329
10th Percentile £324 £350 £336
25th Percentile £408 £413 £413
Median daily rate (50th Percentile) £500 £525 £525
Median % change year-on-year -4.76% - +5.00%
75th Percentile £588 £661 £600
90th Percentile £657 £725 £688
England median daily rate £525 £525 £538
% change year-on-year - -2.33% +5.39%
Number of hourly rates quoted 2 32 27
10th Percentile £12.06 £12.00 £15.46
25th Percentile £12.76 £14.50 £16.85
Median hourly rate £13.92 £16.00 £20.00
Median % change year-on-year -13.00% -20.00% -25.93%
75th Percentile £15.09 £21.00 £26.00
90th Percentile £15.78 £33.49 £30.00
England median hourly rate £23.45 £21.50 £20.56
% change year-on-year +9.07% +4.57% +2.80%

All General Skills
North West

Public Sector falls under the General Skills category. For comparison with the information above, the following table provides summary statistics for all contract job vacancies requiring common skills in the North West.

Contract vacancies with a requirement for common skills 1,134 1,430 1,616
As % of all contract IT jobs advertised in the North West 57.65% 53.62% 52.64%
Number of daily rates quoted 701 874 1,113
10th Percentile £250 £300 £309
25th Percentile £375 £400 £407
Median daily rate (50th Percentile) £475 £500 £500
Median % change year-on-year -5.00% - +5.26%
75th Percentile £575 £588 £588
90th Percentile £675 £688 £675
England median daily rate £525 £538 £550
% change year-on-year -2.33% -2.27% -
Number of hourly rates quoted 104 190 75
10th Percentile £13.00 £12.50 £15.14
25th Percentile £17.44 £14.50 £17.05
Median hourly rate £28.75 £17.86 £26.00
Median % change year-on-year +60.97% -31.31% +5.05%
75th Percentile £56.51 £36.95 £36.17
90th Percentile £77.13 £51.91 £53.20
England median hourly rate £27.45 £30.16 £32.30
% change year-on-year -8.99% -6.63% +50.23%

Public Sector
Job Vacancy Trend in the North West

Job postings citing Public Sector as a proportion of all IT jobs advertised in the North West.
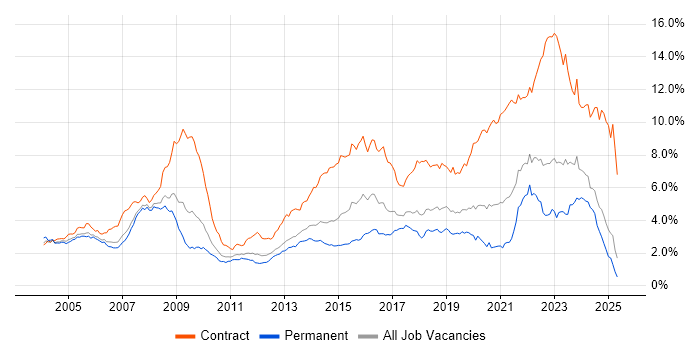
Job vacancy trend for Public Sector in the North West

Public Sector
Contractor Daily Rate Trend in the North West

3-month moving average daily rate quoted in jobs citing Public Sector in the North West.

Daily rate trend for Public Sector in the North West

Public Sector
Daily Rate Histogram in the North West

Daily rate distribution for jobs citing Public Sector in the North West over the 6 months to 17 May 2025.

Daily rate histogram for Public Sector in the North West

Public Sector
Contractor Hourly Rate Trend in the North West

3-month moving average hourly rates quoted in jobs citing Public Sector in the North West.

Hourly rate trend for Public Sector in the North West

Public Sector
Contract Job Locations in the North West

The table below looks at the demand and provides a guide to the median contractor rates quoted in IT jobs citing Public Sector within the North West region over the 6 months to 17 May 2025. The 'Rank Change' column provides an indication of the change in demand within each location based on the same 6 month period last year.

Location Rank Change
on Same Period
Last Year
Matching
Contract
IT Job Ads
Median
Daily Rate
Past 6 Months
Median Daily Rate
% Change
on Same Period
Last Year
Live
Jobs
Manchester +1 113 £500 -4.76% 133
Cheshire -7 22 £395 -4.53% 28
Cumbria -13 20 £550 -15.38% 2
Merseyside -11 17 £600 +41.18% 27
Lancashire -14 10 £600 +15.38% 64
Public Sector
England

Public Sector
Co-occurring Skills and Capabilities in the North West by Category

The follow tables expand on the table above by listing co-occurrences grouped by category. The same employment type, locality and period is covered with up to 20 co-occurrences shown in each of the following categories:

Application Platforms
1 10 (5.24%) SharePoint
2 9 (4.71%) Microsoft Exchange
3 4 (2.09%) Confluence
4 3 (1.57%) Camunda
4 3 (1.57%) IIS
5 1 (0.52%) CICS
5 1 (0.52%) Documentum
5 1 (0.52%) FileNet
5 1 (0.52%) SAS
5 1 (0.52%) Skype for Business
Applications
1 6 (3.14%) Microsoft Office
2 5 (2.62%) Microsoft Excel
3 3 (1.57%) Microsoft Project
4 2 (1.05%) MS Visio
4 2 (1.05%) Spreadsheet
5 1 (0.52%) Adobe Creative Suite
5 1 (0.52%) Microsoft PowerPoint
Business Applications
1 3 (1.57%) Dynamics CRM
1 3 (1.57%) Unit4 Business World
2 2 (1.05%) NetSuite
2 2 (1.05%) Teamcenter
3 1 (0.52%) SAP HR
3 1 (0.52%) SAP S/4HANA
Cloud Services
1 33 (17.28%) Azure
2 21 (10.99%) AWS
3 19 (9.95%) Microsoft 365
4 15 (7.85%) Entra ID
5 13 (6.81%) Serverless
6 12 (6.28%) Power Platform
7 8 (4.19%) SaaS
8 7 (3.66%) Google Workspace
9 5 (2.62%) PowerApps
10 4 (2.09%) Azure DevOps
10 4 (2.09%) IaaS
11 3 (1.57%) Azure Data Factory
11 3 (1.57%) Dynamics 365
12 2 (1.05%) Amazon ECS
12 2 (1.05%) Azure Machine Learning
12 2 (1.05%) Cloud Computing
12 2 (1.05%) GCP
12 2 (1.05%) OneDrive
12 2 (1.05%) Power Automate
12 2 (1.05%) Slack
Communications & Networking
1 10 (5.24%) DNS
2 9 (4.71%) DHCP
2 9 (4.71%) Firewall
3 6 (3.14%) BGP
3 6 (3.14%) EIGRP
3 6 (3.14%) HSRP
3 6 (3.14%) IPsec
3 6 (3.14%) OSPF
4 5 (2.62%) VPN
4 5 (2.62%) Wi-Fi
5 4 (2.09%) Cisco ASA
5 4 (2.09%) Cisco Firepower
5 4 (2.09%) WAN
6 3 (1.57%) Cisco ISE
6 3 (1.57%) NetScaler
7 2 (1.05%) Intrusion Detection
7 2 (1.05%) Network Security
7 2 (1.05%) VoIP
8 1 (0.52%) SD-WAN
8 1 (0.52%) Skype
Database & Business Intelligence
1 17 (8.90%) PostgreSQL
2 11 (5.76%) Relational Database
3 9 (4.71%) Power BI
4 8 (4.19%) MongoDB
5 7 (3.66%) Data Warehouse
6 6 (3.14%) Siebel EIM
7 5 (2.62%) MySQL
8 4 (2.09%) Hadoop
8 4 (2.09%) NoSQL
9 3 (1.57%) SQL Server
10 2 (1.05%) Apache Cassandra
10 2 (1.05%) Big Data
10 2 (1.05%) Tableau
11 1 (0.52%) Data Lake
11 1 (0.52%) Dremio
11 1 (0.52%) DynamoDB
11 1 (0.52%) HBase
11 1 (0.52%) Metadata
11 1 (0.52%) Oracle Database
11 1 (0.52%) Power Query
Development Applications
1 19 (9.95%) Jenkins
2 14 (7.33%) Git
3 12 (6.28%) GitLab
3 12 (6.28%) JUnit
4 10 (5.24%) Gradle
4 10 (5.24%) Liquibase
4 10 (5.24%) Mockito
5 7 (3.66%) JIRA
6 5 (2.62%) Cucumber
6 5 (2.62%) Jasmine
7 4 (2.09%) Selenium
8 3 (1.57%) gulp
8 3 (1.57%) Hudson
8 3 (1.57%) Maven
8 3 (1.57%) Mocha
9 2 (1.05%) Cypress.io
9 2 (1.05%) Grunt
9 2 (1.05%) Visual Studio
10 1 (0.52%) SonarQube
10 1 (0.52%) SQL Server Management Studio (SSMS)
General
1 31 (16.23%) Social Skills
2 27 (14.14%) Finance
3 19 (9.95%) Military
4 12 (6.28%) Marketing
4 12 (6.28%) Telecoms
5 11 (5.76%) Manufacturing
6 10 (5.24%) Analytical Skills
6 10 (5.24%) Banking
6 10 (5.24%) Electronics
7 2 (1.05%) Financial Institution
7 2 (1.05%) Inclusion and Diversity
7 2 (1.05%) Influencing Skills
7 2 (1.05%) Law
7 2 (1.05%) Legal
8 1 (0.52%) Back Office
8 1 (0.52%) Documentation Skills
8 1 (0.52%) General Ledger
8 1 (0.52%) Local Government
8 1 (0.52%) Presentation Skills
8 1 (0.52%) Retail Banking
Job Titles
1 39 (20.42%) Developer
2 27 (14.14%) Senior
3 24 (12.57%) Architect
4 23 (12.04%) Analyst
5 12 (6.28%) Business Analyst
6 11 (5.76%) Java Developer
7 10 (5.24%) Network Engineer
8 8 (4.19%) Senior Developer
8 8 (4.19%) Technical Architect
9 7 (3.66%) Lead
9 7 (3.66%) Project Manager
10 6 (3.14%) Administrator
10 6 (3.14%) Change Manager
10 6 (3.14%) Infrastructure Engineer
10 6 (3.14%) Node.js Developer
10 6 (3.14%) Senior Manager
10 6 (3.14%) Software Engineer
10 6 (3.14%) Solutions Architect
11 5 (2.62%) DevOps Engineer
11 5 (2.62%) Microsoft 365 Engineer
Libraries, Frameworks & Software Standards
1 18 (9.42%) Node.js
2 14 (7.33%) Spring
3 13 (6.81%) Kafka
3 13 (6.81%) OpenAPI
3 13 (6.81%) React
3 13 (6.81%) Spring Boot
3 13 (6.81%) Swagger
4 7 (3.66%) SOAP
5 6 (3.14%) JMS
5 6 (3.14%) RESTful
5 6 (3.14%) Web Services
6 5 (2.62%) PySpark
7 4 (2.09%) .NET
7 4 (2.09%) CSS
7 4 (2.09%) HTML
8 3 (1.57%) 802.1X
8 3 (1.57%) HTML5
8 3 (1.57%) Sass
9 2 (1.05%) AngularJS
9 2 (1.05%) Express.js
Miscellaneous
1 10 (5.24%) Onboarding
2 8 (4.19%) Hybrid Cloud
3 5 (2.62%) Management Information System
4 4 (2.09%) Enterprise Software
4 4 (2.09%) NHS
4 4 (2.09%) Product Ownership
5 3 (1.57%) Data Centre
5 3 (1.57%) Mobile App
6 2 (1.05%) Distributed Denial-of-Service
6 2 (1.05%) Enterprise Cloud
6 2 (1.05%) PKI
6 2 (1.05%) Public Cloud
6 2 (1.05%) Security Operations Centre
6 2 (1.05%) Self-Motivation
7 1 (0.52%) Algorithms
7 1 (0.52%) Distributed Systems
7 1 (0.52%) Legacy Systems
7 1 (0.52%) Linux Command Line
7 1 (0.52%) Low-Code
7 1 (0.52%) Operational Technology
Operating Systems
1 17 (8.90%) Windows
2 14 (7.33%) Windows Server
3 13 (6.81%) Linux
4 5 (2.62%) Red Hat Enterprise Linux
4 5 (2.62%) VMS
4 5 (2.62%) Windows 10
5 4 (2.09%) Unix
6 3 (1.57%) Windows Server 2012
6 3 (1.57%) Windows Server 2016
6 3 (1.57%) Windows Server 2019
7 2 (1.05%) CentOS
7 2 (1.05%) Mac OS
8 1 (0.52%) Android
8 1 (0.52%) Apple iOS
8 1 (0.52%) Mac OS X
8 1 (0.52%) Windows 7
Processes & Methodologies
1 52 (27.23%) Agile
2 36 (18.85%) DevOps
3 28 (14.66%) Migration
4 26 (13.61%) CI/CD
5 24 (12.57%) ITIL
6 23 (12.04%) Microservices
6 23 (12.04%) Problem-Solving
7 20 (10.47%) Containerisation
8 19 (9.95%) Business Intelligence
9 17 (8.90%) Stakeholder Management
10 16 (8.38%) TDD
11 15 (7.85%) Data Modelling
11 15 (7.85%) Software Engineering
12 14 (7.33%) Change Management
13 13 (6.81%) ITSM
14 12 (6.28%) Test Automation
15 11 (5.76%) Continuous Integration
15 11 (5.76%) Programme Management
15 11 (5.76%) Roadmaps
15 11 (5.76%) User Experience
Programming Languages
1 33 (17.28%) SQL
2 31 (16.23%) Java
3 13 (6.81%) Python
4 12 (6.28%) TypeScript
5 8 (4.19%) JavaScript
5 8 (4.19%) PL/SQL
5 8 (4.19%) PowerShell
6 6 (3.14%) Bash
7 2 (1.05%) Go
7 2 (1.05%) Kusto Query Language
7 2 (1.05%) R
8 1 (0.52%) Data Analysis Expressions
8 1 (0.52%) Rust
8 1 (0.52%) Shell Script
8 1 (0.52%) T-SQL
8 1 (0.52%) VB
8 1 (0.52%) VBScript
Qualifications
1 103 (53.93%) Security Cleared
2 78 (40.84%) SC Cleared
3 7 (3.66%) Degree
4 5 (2.62%) DBS Check
5 4 (2.09%) Microsoft Certification
6 3 (1.57%) BPSS Clearance
7 2 (1.05%) Azure Certification
8 1 (0.52%) A+ Certification
8 1 (0.52%) AWS Certification
8 1 (0.52%) CIPD
8 1 (0.52%) CISM
8 1 (0.52%) Computer Science Degree
8 1 (0.52%) CTC Cleared
8 1 (0.52%) DV Cleared
8 1 (0.52%) ISTQB
8 1 (0.52%) ITIL Certification
8 1 (0.52%) ITIL Foundation Certificate
8 1 (0.52%) Master's Degree
8 1 (0.52%) PMP
8 1 (0.52%) PRINCE2 Practitioner
Quality Assurance & Compliance
1 7 (3.66%) Accessibility
2 6 (3.14%) SLA
3 3 (1.57%) NIST
3 3 (1.57%) WCAG
4 2 (1.05%) Data Quality
4 2 (1.05%) ISO/IEC 27001
4 2 (1.05%) NCSC
4 2 (1.05%) PCI DSS
4 2 (1.05%) QA
5 1 (0.52%) COBIT
5 1 (0.52%) GDPR
5 1 (0.52%) GRC
5 1 (0.52%) HMG Security Policy Framework
5 1 (0.52%) ISO/IEC 27002 (supersedes ISO/IEC 17799)
5 1 (0.52%) JSP 440
5 1 (0.52%) NIST 800
5 1 (0.52%) PMO
5 1 (0.52%) Sarbanes-Oxley
System Software
1 21 (10.99%) Docker
2 17 (8.90%) Active Directory
3 5 (2.62%) BitLocker
3 5 (2.62%) VMware Infrastructure
4 4 (2.09%) Hyper-V
5 3 (1.57%) Virtual Machines
5 3 (1.57%) VMware ESXi
6 2 (1.05%) vSphere
7 1 (0.52%) Firmware
7 1 (0.52%) VMware NSX
Systems Management
1 12 (6.28%) Kubernetes
2 11 (5.76%) Microsoft Intune
2 11 (5.76%) Terraform
3 8 (4.19%) WSUS
4 7 (3.66%) Single Sign-On
5 5 (2.62%) Grafana
6 3 (1.57%) Ansible
6 3 (1.57%) Microsoft Clustering
6 3 (1.57%) NetApp OnCommand
6 3 (1.57%) Packer
6 3 (1.57%) vCenter Server
6 3 (1.57%) vMotion
7 2 (1.05%) Prometheus
8 1 (0.52%) Active Directory Federation Services
8 1 (0.52%) Consul
8 1 (0.52%) HP ALM
8 1 (0.52%) Istio
8 1 (0.52%) linkerd
8 1 (0.52%) Rancher
8 1 (0.52%) VxRail
Vendors
1 44 (23.04%) Microsoft
2 13 (6.81%) Oracle
3 12 (6.28%) Virgin Media
4 11 (5.76%) Google
4 11 (5.76%) SAP
4 11 (5.76%) VMware
5 10 (5.24%) Cisco
6 8 (4.19%) CheckPoint
7 7 (3.66%) Palo Alto
8 6 (3.14%) Databricks
8 6 (3.14%) Siebel
9 5 (2.62%) CyberArk
9 5 (2.62%) ServiceNow
10 4 (2.09%) Citrix
10 4 (2.09%) Splunk
10 4 (2.09%) Zscaler
11 3 (1.57%) Informatica
11 3 (1.57%) Meraki
11 3 (1.57%) SolarWinds
12 2 (1.05%) Adobe