Linux Contracts in Scotland

Linux
UK > Scotland

The following table provides summary statistics for contract job vacancies advertised in Scotland with a requirement for Linux skills. Included is a benchmarking guide to the contractor rates offered in vacancies that have cited Linux over the 6 months to 27 April 2024 with a comparison to the same period in the previous 2 years.

6 months to
27 Apr 2024
Same period 2023 Same period 2022
Rank 22 17 30
Rank change year-on-year -5 +13 +3
Contract jobs citing Linux 179 273 209
As % of all contract jobs advertised in Scotland 8.11% 9.57% 5.94%
As % of the Operating Systems category 49.72% 51.41% 40.90%
Number of daily rates quoted 110 178 147
10th Percentile £325 £408 £325
25th Percentile £463 £463 £425
Median daily rate (50th Percentile) £595 £525 £493
Median % change year-on-year +13.33% +6.49% +16.00%
75th Percentile £671 £676 £550
90th Percentile £750 £750 £610
UK median daily rate £550 £575 £570
% change year-on-year -4.35% +0.88% +14.00%
Number of hourly rates quoted 7 6 8
10th Percentile - £49.49 £46.08
25th Percentile £57.50 £53.20 £49.14
Median hourly rate £60.50 £59.79 £52.81
Median % change year-on-year +1.19% +13.22% -20.59%
75th Percentile £62.50 £65.06 £56.19
90th Percentile - £67.66 £57.50
UK median hourly rate £60.50 £65.00 £60.00
% change year-on-year -6.92% +8.33% +20.00%

All Operating Systems
Scotland

Linux is in the Operating Systems category. The following table is for comparison with the above and provides summary statistics for all contract job vacancies advertised in Scotland with a requirement for operating system skills.

Contract vacancies with a requirement for operating system skills 360 531 511
As % of all contract IT jobs advertised in Scotland 16.31% 18.61% 14.51%
Number of daily rates quoted 236 372 346
10th Percentile £182 £160 £137
25th Percentile £325 £260 £201
Median daily rate (50th Percentile) £500 £480 £450
Median % change year-on-year +4.28% +6.56% +12.50%
75th Percentile £625 £600 £538
90th Percentile £744 £730 £600
UK median daily rate £470 £505 £500
% change year-on-year -6.93% +1.00% +11.11%
Number of hourly rates quoted 15 13 24
10th Percentile £17.23 £17.72 £15.04
25th Percentile £18.27 £20.79 £17.03
Median hourly rate £52.50 £52.50 £20.00
Median % change year-on-year - +162.50% +33.33%
75th Percentile £60.75 £59.03 £49.85
90th Percentile £62.50 £65.36 £55.75
UK median hourly rate £22.00 £38.75 £22.28
% change year-on-year -43.23% +73.92% +23.78%

Linux
Job Vacancy Trend in Scotland

Job postings citing Linux as a proportion of all IT jobs advertised in Scotland.
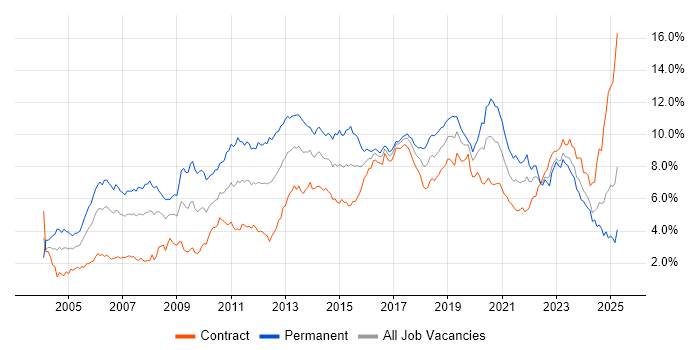
Job vacancy trend for Linux in Scotland

Linux
Contractor Daily Rate Trend in Scotland

3-month moving average daily rate quoted in jobs citing Linux in Scotland.

Daily rate trend for Linux in Scotland

Linux
Daily Rate Histogram in Scotland

Daily rate distribution for jobs citing Linux in Scotland over the 6 months to 27 April 2024.

Daily rate histogram for Linux in Scotland

Linux
Contractor Hourly Rate Trend in Scotland

3-month moving average hourly rates quoted in jobs citing Linux in Scotland.

Hourly rate trend for Linux in Scotland

Linux
Contract Job Locations in Scotland

The table below looks at the demand and provides a guide to the median contractor rates quoted in IT jobs citing Linux within the Scotland region over the 6 months to 27 April 2024. The 'Rank Change' column provides an indication of the change in demand within each location based on the same 6 month period last year.

Location Rank Change
on Same Period
Last Year
Matching
Contract
IT Job Ads
Median
Daily Rate
Past 6 Months
Median Daily Rate
% Change
on Same Period
Last Year
Live
Jobs
Glasgow -6 114 £588 -9.62% 22
Edinburgh -5 27 £570 +14.00% 42
South Lanarkshire - 20 £600 - 4
Aberdeen - 4 £625 - 4
Perthshire +12 3 £475 -6.68%
Fife +1 2 £365 - 2
West Lothian +1 2 £650 +62.50% 1
Renfrewshire -2 1 £600 +20.80%
Linux
UK

Linux
Co-occurring Skills and Capabilities in Scotland by Category

The follow tables expand on the table above by listing co-occurrences grouped by category. The same employment type, locality and period is covered with up to 20 co-occurrences shown in each of the following categories:

Application Platforms
1 19 (10.61%) Confluence
2 7 (3.91%) SAS
3 6 (3.35%) IIS
4 5 (2.79%) Microsoft Exchange
5 2 (1.12%) WebLogic
6 1 (0.56%) Apache
6 1 (0.56%) Cloud Foundry
6 1 (0.56%) JBoss
6 1 (0.56%) Jupyter
6 1 (0.56%) SharePoint
6 1 (0.56%) Tomcat
6 1 (0.56%) WildFly
Applications
1 1 (0.56%) Microsoft Office
Cloud Services
1 45 (25.14%) AWS
2 21 (11.73%) OpenShift
3 18 (10.06%) Azure
4 12 (6.70%) Amazon EC2
4 12 (6.70%) Amazon S3
4 12 (6.70%) AWS Lambda
4 12 (6.70%) Serverless
5 11 (6.15%) AWS CloudFormation
6 10 (5.59%) IaaS
7 8 (4.47%) Amazon OpenSearch
8 7 (3.91%) Amazon EKS
9 5 (2.79%) Amazon ECS
9 5 (2.79%) AWS Fargate
10 4 (2.23%) Amazon Cognito
11 3 (1.68%) Amazon CloudWatch
11 3 (1.68%) OCI
11 3 (1.68%) Oracle Service Cloud
12 2 (1.12%) Azure DevOps
12 2 (1.12%) Microsoft 365
12 2 (1.12%) Power Platform
Communications & Networking
1 18 (10.06%) Firewall
2 12 (6.70%) TCP/IP
3 9 (5.03%) DNS
3 9 (5.03%) HTTP
3 9 (5.03%) SSL
4 8 (4.47%) Fibre Channel
4 8 (4.47%) iSCSI
5 7 (3.91%) DHCP
5 7 (3.91%) F5 BIG-IP LTM
5 7 (3.91%) NetScaler
6 6 (3.35%) SAN
7 5 (2.79%) Internet
8 4 (2.23%) LAN
9 3 (1.68%) WAN
10 2 (1.12%) Cisco ASA
10 2 (1.12%) NAS
10 2 (1.12%) SNMP
11 1 (0.56%) Network Security
11 1 (0.56%) Wireshark
11 1 (0.56%) WLAN
Database & Business Intelligence
1 10 (5.59%) Oracle Database
2 8 (4.47%) PostgreSQL
3 7 (3.91%) Elasticsearch
4 6 (3.35%) Oracle Reports
4 6 (3.35%) SQL Server
5 5 (2.79%) DB2
5 5 (2.79%) InfluxDB
5 5 (2.79%) Oracle Database 12c
5 5 (2.79%) Oracle8/8i Database
6 4 (2.23%) Amazon RDS
6 4 (2.23%) MariaDB
6 4 (2.23%) Metadata
6 4 (2.23%) MySQL
7 3 (1.68%) Amazon Athena
7 3 (1.68%) Amazon Aurora
7 3 (1.68%) Relational Database
8 2 (1.12%) Big Data
8 2 (1.12%) Informix
8 2 (1.12%) MongoDB
8 2 (1.12%) NonStop SQL
Development Applications
1 27 (15.08%) Jenkins
2 25 (13.97%) Git
3 20 (11.17%) JIRA
4 10 (5.59%) Artifactory
5 9 (5.03%) Maven
6 8 (4.47%) Gradle
7 7 (3.91%) GitLab
8 3 (1.68%) Burp Suite
8 3 (1.68%) Cucumber
8 3 (1.68%) Selenium
8 3 (1.68%) WebDriver
9 2 (1.12%) Capybara
9 2 (1.12%) Oracle Forms
9 2 (1.12%) Terragrunt
10 1 (0.56%) Bitbucket
10 1 (0.56%) Bitbucket Server
10 1 (0.56%) CMake
10 1 (0.56%) Gatling
10 1 (0.56%) JUnit
10 1 (0.56%) Sonatype Nexus
General
1 42 (23.46%) Social Skills
2 31 (17.32%) Finance
3 27 (15.08%) Public Sector
4 23 (12.85%) Banking
5 13 (7.26%) Investment Banking
6 8 (4.47%) Documentation Skills
6 8 (4.47%) Financial Institution
7 7 (3.91%) Analytical Skills
8 4 (2.23%) Electronics
8 4 (2.23%) Telecoms
9 3 (1.68%) Influencing Skills
9 3 (1.68%) Organisational Skills
10 1 (0.56%) Inclusion and Diversity
10 1 (0.56%) Military
Job Titles
1 31 (17.32%) Developer
2 27 (15.08%) Linux Engineer
3 26 (14.53%) Python Engineer
4 25 (13.97%) DevOps Engineer
5 19 (10.61%) Java Developer
6 16 (8.94%) Infrastructure Engineer
7 15 (8.38%) Linux Developer
8 13 (7.26%) Platform Engineer
9 12 (6.70%) Java Scala Developer
9 12 (6.70%) Scala Developer
10 11 (6.15%) Administrator
10 11 (6.15%) Linux Infrastructure Engineer
10 11 (6.15%) Linux Scripter
10 11 (6.15%) Senior
11 10 (5.59%) Software Engineer
12 9 (5.03%) Consultant
12 9 (5.03%) DBA
12 9 (5.03%) Hardware Engineer
12 9 (5.03%) Support Engineer
12 9 (5.03%) Systems Administrator
Libraries, Frameworks & Software Standards
1 19 (10.61%) REST
2 10 (5.59%) AWS CDK
2 10 (5.59%) Middleware
3 8 (4.47%) Web Services
4 7 (3.91%) Flash
4 7 (3.91%) POSIX
5 6 (3.35%) AngularJS
6 5 (2.79%) Oracle GoldenGate
6 5 (2.79%) Twisted
7 3 (1.68%) Gherkin
7 3 (1.68%) RabbitMQ
7 3 (1.68%) React
7 3 (1.68%) Spring
8 2 (1.12%) Elastic Stack
8 2 (1.12%) Java EE
8 2 (1.12%) Redfish
8 2 (1.12%) RESTful
8 2 (1.12%) Spring Boot
8 2 (1.12%) WebKit
9 1 (0.56%) FastAPI
Miscellaneous
1 18 (10.06%) Data Centre
2 11 (6.15%) Linux Command Line
2 11 (6.15%) Product Ownership
3 10 (5.59%) Data Protection Act
4 7 (3.91%) Cloud Native
5 6 (3.35%) Algorithms
5 6 (3.35%) Data Structures
5 6 (3.35%) Embedded Systems
6 5 (2.79%) Client/Server
6 5 (2.79%) NVMe
6 5 (2.79%) Public Cloud
7 4 (2.23%) Device Driver
7 4 (2.23%) IoT
7 4 (2.23%) Management Information System
7 4 (2.23%) Operational Technology
7 4 (2.23%) PCIe
7 4 (2.23%) Verilog
7 4 (2.23%) VHDL
8 3 (1.68%) Clustering
8 3 (1.68%) Cyber Defence
Operating Systems
1 53 (29.61%) Unix
2 41 (22.91%) Windows
3 30 (16.76%) Red Hat Enterprise Linux
4 19 (10.61%) Windows Server
5 8 (4.47%) Embedded Linux
6 7 (3.91%) Ubuntu
7 6 (3.35%) CentOS
7 6 (3.35%) Debian
7 6 (3.35%) Windows Server 2008
7 6 (3.35%) Windows Server 2012
7 6 (3.35%) Windows Server 2016
8 4 (2.23%) Data ONTAP
8 4 (2.23%) VxWorks
9 3 (1.68%) Kali Linux
9 3 (1.68%) Oracle Linux
9 3 (1.68%) Solaris
10 1 (0.56%) AIX
Processes & Methodologies
1 56 (31.28%) Agile
2 44 (24.58%) CI/CD
2 44 (24.58%) DevOps
3 28 (15.64%) Infrastructure as Code
4 26 (14.53%) Software Engineering
5 22 (12.29%) OO
6 21 (11.73%) High Availability
6 21 (11.73%) Migration
7 17 (9.50%) Continuous Integration
7 17 (9.50%) Infrastructure Engineering
8 16 (8.94%) Roadmaps
9 15 (8.38%) Containerisation
9 15 (8.38%) Infrastructure Automation
9 15 (8.38%) Observability
9 15 (8.38%) Problem-Solving
10 13 (7.26%) Data Protection
10 13 (7.26%) Test Automation
11 12 (6.70%) Configuration Management
11 12 (6.70%) Task Automation
12 11 (6.15%) Site Reliability Engineering
Programming Languages
1 88 (49.16%) Python
2 45 (25.14%) Perl
3 43 (24.02%) Java
4 31 (17.32%) Bash
5 19 (10.61%) SQL
6 12 (6.70%) Groovy
6 12 (6.70%) JavaScript
6 12 (6.70%) Scala
6 12 (6.70%) Shell Script
7 9 (5.03%) C
8 8 (4.47%) Ruby
9 6 (3.35%) PowerShell
10 5 (2.79%) Embedded C
11 4 (2.23%) TypeScript
12 3 (1.68%) C++
12 3 (1.68%) Embedded C++
Qualifications
1 32 (17.88%) Security Cleared
2 25 (13.97%) SC Cleared
3 9 (5.03%) Degree
4 6 (3.35%) MCSA
4 6 (3.35%) MCSE
4 6 (3.35%) Microsoft Certification
4 6 (3.35%) RHCT
5 3 (1.68%) OSCP
6 2 (1.12%) BPSS Clearance
6 2 (1.12%) Computer Science Degree
6 2 (1.12%) DV Cleared
6 2 (1.12%) RHCE
Quality Assurance & Compliance
1 6 (3.35%) Disclosure Scotland
2 5 (2.79%) PCI DSS
3 4 (2.23%) MISRA
3 4 (2.23%) MISRA C
4 3 (1.68%) QA
5 2 (1.12%) SLA
6 1 (0.56%) Accessibility
6 1 (0.56%) NCSC
6 1 (0.56%) NIST
System Software
1 17 (9.50%) VMware Infrastructure
2 11 (6.15%) Docker
3 9 (5.03%) KVM
4 8 (4.47%) Active Directory
4 8 (4.47%) Firmware
5 7 (3.91%) NFS
6 6 (3.35%) Hyper-V
7 5 (2.79%) Oracle RAC
8 4 (2.23%) GPFS
9 2 (1.12%) Virtual Servers
10 1 (0.56%) Apache ZooKeeper
10 1 (0.56%) HDFS
10 1 (0.56%) VMware ESXi
Systems Management
1 32 (17.88%) Kubernetes
2 24 (13.41%) Ansible
3 18 (10.06%) Terraform
4 15 (8.38%) Grafana
5 7 (3.91%) Kibana
6 6 (3.35%) Prometheus
6 6 (3.35%) Red Hat Satellite
7 5 (2.79%) Oracle RMAN
8 4 (2.23%) Data Guard
8 4 (2.23%) Packer
8 4 (2.23%) Veritas Storage Foundation
9 3 (1.68%) Nagios
9 3 (1.68%) Puppet
10 2 (1.12%) Dell DRAC
10 2 (1.12%) NetBackup
10 2 (1.12%) OpenView
10 2 (1.12%) Progress Chef
11 1 (0.56%) Active Directory Federation Services
11 1 (0.56%) Argo
11 1 (0.56%) ITRS Geneos
Vendors
1 20 (11.17%) Atlassian
1 20 (11.17%) Red Hat
2 19 (10.61%) Oracle
3 18 (10.06%) VMware
4 10 (5.59%) F5
5 7 (3.91%) Microsoft
6 6 (3.35%) Citrix
6 6 (3.35%) Veritas
7 5 (2.79%) Google
7 5 (2.79%) Splunk
8 4 (2.23%) Brocade
8 4 (2.23%) EMC
8 4 (2.23%) IBM
8 4 (2.23%) Intel
8 4 (2.23%) NetApp
8 4 (2.23%) Sybase
9 3 (1.68%) Commvault
9 3 (1.68%) Fortinet
10 2 (1.12%) BMC
10 2 (1.12%) SolarWinds