DevOps Contracts in Scotland

DevOps
UK > Scotland

The following table provides summary statistics for contract job vacancies advertised in Scotland with a requirement for DevOps skills. Included is a benchmarking guide to the contractor rates offered in vacancies that have cited DevOps over the 6 months to 8 May 2024 with a comparison to the same period in the previous 2 years.

6 months to
8 May 2024
Same period 2023 Same period 2022
Rank 19 8 9
Rank change year-on-year -11 +1 +4
Contract jobs citing DevOps 177 412 408
As % of all contract jobs advertised in Scotland 8.12% 14.90% 11.74%
As % of the Processes & Methodologies category 9.19% 16.10% 12.62%
Number of daily rates quoted 123 333 286
10th Percentile £363 £407 £406
25th Percentile £415 £438 £431
Median daily rate (50th Percentile) £475 £500 £500
Median % change year-on-year -5.00% - +8.34%
75th Percentile £588 £570 £575
90th Percentile £640 £671 £675
UK median daily rate £550 £579 £575
% change year-on-year -4.97% +0.65% +9.52%
Number of hourly rates quoted 2 1 0
10th Percentile £28.53 - -
25th Percentile £32.31 - -
Median hourly rate £39.25 £70.00 -
Median % change year-on-year -43.93% - -
75th Percentile £46.81 - -
90th Percentile £50.98 - -
UK median hourly rate £65.00 £65.50 £55.00
% change year-on-year -0.76% +19.09% +22.22%

All Process and Methodology Skills
Scotland

DevOps is in the Processes and Methodologies category. The following table is for comparison with the above and provides summary statistics for all contract job vacancies advertised in Scotland with a requirement for process or methodology skills.

Contract vacancies with a requirement for process or methodology skills 1,925 2,559 3,234
As % of all contract IT jobs advertised in Scotland 88.26% 92.55% 93.09%
Number of daily rates quoted 1,163 1,839 2,293
10th Percentile £222 £260 £250
25th Percentile £373 £406 £400
Median daily rate (50th Percentile) £475 £475 £470
Median % change year-on-year - +1.06% +10.59%
75th Percentile £575 £557 £550
90th Percentile £659 £650 £625
UK median daily rate £525 £550 £530
% change year-on-year -4.55% +3.77% +8.72%
Number of hourly rates quoted 91 56 48
10th Percentile £12.30 £10.63 £15.04
25th Percentile £15.84 £12.04 £19.45
Median hourly rate £19.50 £16.86 £40.00
Median % change year-on-year +15.69% -57.86% -0.01%
75th Percentile £50.88 £49.24 £48.95
90th Percentile £60.75 £65.78 £55.75
UK median hourly rate £36.50 £36.00 £25.00
% change year-on-year +1.39% +44.00% +2.04%

DevOps
Job Vacancy Trend in Scotland

Job postings citing DevOps as a proportion of all IT jobs advertised in Scotland.
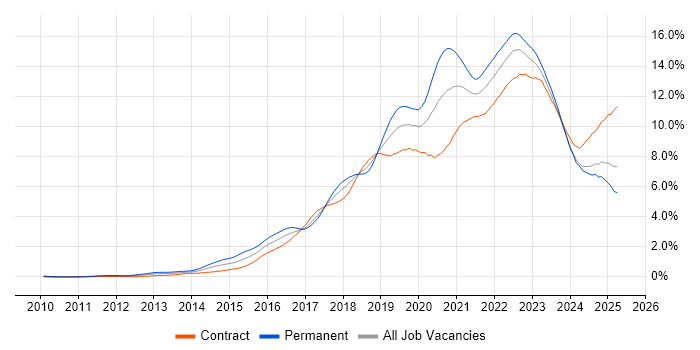
Job vacancy trend for DevOps in Scotland

DevOps
Contractor Daily Rate Trend in Scotland

3-month moving average daily rate quoted in jobs citing DevOps in Scotland.

Daily rate trend for DevOps in Scotland

DevOps
Daily Rate Histogram in Scotland

Daily rate distribution for jobs citing DevOps in Scotland over the 6 months to 8 May 2024.

Daily rate histogram for DevOps in Scotland

DevOps
Contractor Hourly Rate Trend in Scotland

3-month moving average hourly rates quoted in jobs citing DevOps in Scotland.

Hourly rate trend for DevOps in Scotland

DevOps
Hourly Rate Histogram in Scotland

Hourly rate distribution of jobs citing DevOps in Scotland over the 6 months to 8 May 2024.

Hourly rate histogram for DevOps in Scotland

DevOps
Contract Job Locations in Scotland

The table below looks at the demand and provides a guide to the median contractor rates quoted in IT jobs citing DevOps within the Scotland region over the 6 months to 8 May 2024. The 'Rank Change' column provides an indication of the change in demand within each location based on the same 6 month period last year.

Location Rank Change
on Same Period
Last Year
Matching
Contract
IT Job Ads
Median
Daily Rate
Past 6 Months
Median Daily Rate
% Change
on Same Period
Last Year
Live
Jobs
Glasgow -6 78 £487 -11.50% 23
Edinburgh -10 71 £450 -6.05% 40
Perthshire -1 7 £513 -9.77% 2
Lanarkshire +3 3 £400 -33.33% 12
Aberdeenshire - 1 - - 1
Renfrewshire - 1 £600 -
South Lanarkshire - 1 - -
DevOps
UK

DevOps
Co-occurring Skills and Capabilities in Scotland by Category

The follow tables expand on the table above by listing co-occurrences grouped by category. The same employment type, locality and period is covered with up to 20 co-occurrences shown in each of the following categories:

Application Platforms
1 14 (7.91%) Confluence
2 11 (6.21%) Apache Airflow
3 4 (2.26%) Apache
4 3 (1.69%) Apache Spark
4 3 (1.69%) GeoServer
4 3 (1.69%) SharePoint
5 2 (1.13%) SAS
6 1 (0.56%) Cloud Foundry
6 1 (0.56%) JBoss
6 1 (0.56%) Jupyter
6 1 (0.56%) Tomcat
6 1 (0.56%) WildFly
6 1 (0.56%) WordPress
Applications
1 2 (1.13%) Microsoft Office
2 1 (0.56%) Microsoft Excel
2 1 (0.56%) Microsoft PowerPoint
2 1 (0.56%) MS Visio
Business Applications
1 6 (3.39%) Maximo
2 1 (0.56%) NetSuite
Cloud Services
1 75 (42.37%) Azure
2 59 (33.33%) AWS
3 51 (28.81%) Azure DevOps
4 29 (16.38%) OpenShift
5 19 (10.73%) AWS CloudFormation
6 16 (9.04%) Serverless
7 15 (8.47%) Amazon S3
7 15 (8.47%) AWS Lambda
8 12 (6.78%) Snowflake
9 8 (4.52%) Power Platform
10 7 (3.95%) AWS CodePipeline
11 6 (3.39%) Amazon EC2
11 6 (3.39%) Amazon ECS
11 6 (3.39%) Amazon EKS
11 6 (3.39%) Amazon OpenSearch
11 6 (3.39%) AWS Fargate
12 5 (2.82%) GCP
12 5 (2.82%) IaaS
12 5 (2.82%) SaaS
13 3 (1.69%) Dynamics 365
Communications & Networking
1 3 (1.69%) DHCP
1 3 (1.69%) DNS
2 2 (1.13%) Fibre Channel
2 2 (1.13%) iSCSI
2 2 (1.13%) SAN
3 1 (0.56%) 2G
3 1 (0.56%) 5G
3 1 (0.56%) Firewall
3 1 (0.56%) NAS
3 1 (0.56%) Network Security
3 1 (0.56%) TCP/IP
3 1 (0.56%) Wireless
Database & Business Intelligence
1 21 (11.86%) PostgreSQL
2 10 (5.65%) Elasticsearch
2 10 (5.65%) GIS
3 9 (5.08%) SQL Server
4 8 (4.52%) Data Warehouse
5 7 (3.95%) Amazon Aurora
5 7 (3.95%) NoSQL
5 7 (3.95%) Relational Database
6 4 (2.26%) Amazon RDS
6 4 (2.26%) Big Data
6 4 (2.26%) MongoDB
6 4 (2.26%) MySQL
6 4 (2.26%) Power BI
7 3 (1.69%) DB2
7 3 (1.69%) InfluxDB
8 2 (1.13%) Data Lake
8 2 (1.13%) Hadoop
8 2 (1.13%) MariaDB
8 2 (1.13%) Oracle Database
9 1 (0.56%) Apache Hive
Development Applications
1 37 (20.90%) Jenkins
2 24 (13.56%) Git
3 20 (11.30%) JIRA
4 13 (7.34%) GitLab
5 8 (4.52%) Selenium
6 7 (3.95%) Artifactory
6 7 (3.95%) WebDriver
7 5 (2.82%) Visual Studio
8 4 (2.26%) Maven
9 3 (1.69%) Gradle
9 3 (1.69%) Subversion
9 3 (1.69%) TeamCity
10 2 (1.13%) Bitbucket
10 2 (1.13%) Cucumber
10 2 (1.13%) Cypress.io
10 2 (1.13%) Terragrunt
10 2 (1.13%) Tricentis qTest
11 1 (0.56%) Appium
11 1 (0.56%) gulp
11 1 (0.56%) Octopus Deploy
General
1 53 (29.94%) Public Sector
2 33 (18.64%) Social Skills
3 26 (14.69%) Finance
4 16 (9.04%) Banking
5 14 (7.91%) Analytical Skills
6 6 (3.39%) Documentation Skills
6 6 (3.39%) Influencing Skills
7 5 (2.82%) Manufacturing
7 5 (2.82%) Organisational Skills
8 4 (2.26%) Electronics
8 4 (2.26%) Marketing
8 4 (2.26%) Telecoms
9 2 (1.13%) Inclusion and Diversity
9 2 (1.13%) Investment Banking
9 2 (1.13%) Legal
10 1 (0.56%) Automotive
Job Titles
1 37 (20.90%) DevOps Engineer
2 34 (19.21%) Developer
3 20 (11.30%) Python Engineer
4 18 (10.17%) AWS Engineer
5 15 (8.47%) Platform Engineer
5 15 (8.47%) Senior
6 13 (7.34%) Analyst
6 13 (7.34%) Data Engineer
6 13 (7.34%) Infrastructure Engineer
7 12 (6.78%) .NET Developer
7 12 (6.78%) Cloud Platform Engineer
7 12 (6.78%) Java Developer
8 10 (5.65%) Lead
9 9 (5.08%) AWS DevOps
9 9 (5.08%) AWS DevOps Engineer
9 9 (5.08%) React Developer
9 9 (5.08%) Windows Engineer
10 8 (4.52%) Linux Engineer
10 8 (4.52%) Senior .NET Developer
10 8 (4.52%) Windows Infrastructure Engineer
Libraries, Frameworks & Software Standards
1 23 (12.99%) .NET
2 20 (11.30%) AWS CDK
3 18 (10.17%) REST
4 17 (9.60%) React
5 15 (8.47%) Spring
6 12 (6.78%) Spring Boot
7 9 (5.08%) HTML
8 8 (4.52%) CSS
8 8 (4.52%) PostGIS
9 7 (3.95%) Middleware
9 7 (3.95%) RESTful
10 6 (3.39%) RabbitMQ
11 5 (2.82%) Node.js
11 5 (2.82%) OAuth
11 5 (2.82%) OAuth2
11 5 (2.82%) Spring Security
12 4 (2.26%) Playwright
12 4 (2.26%) Spring MVC
12 4 (2.26%) Thymeleaf
12 4 (2.26%) WinForms
Miscellaneous
1 13 (7.34%) Product Ownership
2 12 (6.78%) Legacy Applications
2 12 (6.78%) Legacy Systems
3 11 (6.21%) Distributed Systems
3 11 (6.21%) Wiki
4 6 (3.39%) Data Protection Act
5 4 (2.26%) Mobile App
5 4 (2.26%) Renewable Energy
6 3 (1.69%) Client/Server
6 3 (1.69%) Management Information System
7 2 (1.13%) Cloud Native
7 2 (1.13%) Equities
7 2 (1.13%) Foreign Exchange (FX)
7 2 (1.13%) Greenfield Project
7 2 (1.13%) NVMe
7 2 (1.13%) Onboarding
7 2 (1.13%) PKI
7 2 (1.13%) Public Cloud
7 2 (1.13%) Self-Motivation
7 2 (1.13%) Virtual Team
Operating Systems
1 36 (20.34%) Linux
2 18 (10.17%) Windows
3 17 (9.60%) Unix
4 12 (6.78%) Red Hat Enterprise Linux
5 6 (3.39%) Ubuntu
6 5 (2.82%) Mac OS
7 4 (2.26%) VMS
8 1 (0.56%) AIX
8 1 (0.56%) Android
8 1 (0.56%) Apple iOS
8 1 (0.56%) Data ONTAP
8 1 (0.56%) Windows Server
Processes & Methodologies
1 90 (50.85%) Agile
2 43 (24.29%) CI/CD
3 31 (17.51%) Test Automation
4 25 (14.12%) Infrastructure as Code
5 23 (12.99%) User Experience
6 21 (11.86%) Code Quality
7 20 (11.30%) Containerisation
8 18 (10.17%) Infrastructure Engineering
8 18 (10.17%) Scrum
9 17 (9.60%) Project Management
10 16 (9.04%) Roadmaps
11 15 (8.47%) Computer Science
11 15 (8.47%) Problem-Solving
12 14 (7.91%) Artificial Intelligence
12 14 (7.91%) Kanban
12 14 (7.91%) Microservices
13 13 (7.34%) Analytics
13 13 (7.34%) GitOps
13 13 (7.34%) Knowledge Transfer
13 13 (7.34%) Platform Engineering
Programming Languages
1 83 (46.89%) Python
2 39 (22.03%) Java
3 31 (17.51%) SQL
4 23 (12.99%) C#
5 21 (11.86%) JavaScript
6 17 (9.60%) Perl
7 14 (7.91%) PowerShell
8 12 (6.78%) Scala
9 11 (6.21%) Bash
10 9 (5.08%) Groovy
11 8 (4.52%) TypeScript
12 6 (3.39%) Shell Script
13 4 (2.26%) C
13 4 (2.26%) Ruby
13 4 (2.26%) VB
13 4 (2.26%) VB6
14 3 (1.69%) C++
15 2 (1.13%) Go
15 2 (1.13%) VBA
15 2 (1.13%) VBScript
Qualifications
1 12 (6.78%) Security Cleared
2 9 (5.08%) SC Cleared
3 4 (2.26%) Degree
3 4 (2.26%) ISEB
4 2 (1.13%) ISEB Practitioner
4 2 (1.13%) ISTQB
4 2 (1.13%) ISTQB Foundation Certification
5 1 (0.56%) Azure Certification
5 1 (0.56%) BPSS Clearance
5 1 (0.56%) Computer Science Degree
5 1 (0.56%) ITIL Certification
Quality Assurance & Compliance
1 16 (9.04%) Disclosure Scotland
2 8 (4.52%) QA
3 7 (3.95%) Accessibility
3 7 (3.95%) PMO
4 2 (1.13%) GDPR
5 1 (0.56%) NCSC
5 1 (0.56%) WCAG
System Software
1 35 (19.77%) Docker
2 9 (5.08%) VMware Infrastructure
3 2 (1.13%) NFS
4 1 (0.56%) Apache ZooKeeper
4 1 (0.56%) GPFS
4 1 (0.56%) HDFS
4 1 (0.56%) KVM
4 1 (0.56%) Virtual Servers
4 1 (0.56%) VMware ESXi
Systems Management
1 35 (19.77%) Kubernetes
2 32 (18.08%) Terraform
3 18 (10.17%) Grafana
4 17 (9.60%) Ansible
5 9 (5.08%) Kibana
6 7 (3.95%) SCCM
7 4 (2.26%) HP Quality Center
8 3 (1.69%) Microsoft Intune
8 3 (1.69%) Packer
8 3 (1.69%) Progress Chef
8 3 (1.69%) Prometheus
8 3 (1.69%) Puppet
9 1 (0.56%) Argo
9 1 (0.56%) Hadoop YARN
9 1 (0.56%) Icinga
9 1 (0.56%) Istio
9 1 (0.56%) ITRS Geneos
9 1 (0.56%) Knative
9 1 (0.56%) vCenter Server
9 1 (0.56%) vRealize
Vendors
1 13 (7.34%) Databricks
2 12 (6.78%) Splunk
3 10 (5.65%) Oracle
3 10 (5.65%) VMware
4 9 (5.08%) Microsoft
5 4 (2.26%) Google
5 4 (2.26%) HP
5 4 (2.26%) Infragistics
5 4 (2.26%) SAP
6 2 (1.13%) Adobe
6 2 (1.13%) Sybase
6 2 (1.13%) Xamarin
7 1 (0.56%) Atlassian
7 1 (0.56%) Brocade
7 1 (0.56%) Dell
7 1 (0.56%) EMC
7 1 (0.56%) IBM
7 1 (0.56%) NetApp
7 1 (0.56%) Veritas