SharePoint Contract Job Trends in the South East

Microsoft SharePoint
England > South East

The table below provides summary statistics and contractor rates for jobs advertised in the South East requiring SharePoint skills. It covers vacancies from the 6 months leading up to 21 September 2025, with comparisons to the same periods in the previous two years.

6 months to
21 Sep 2025
Same period 2024 Same period 2023
Rank 80 103 103
Rank change year-on-year +23 0 -12
Contract jobs citing SharePoint 88 83 117
As % of all contract jobs advertised in the South East 2.55% 1.82% 2.08%
As % of the Application Platforms category 25.29% 21.50% 20.24%
Number of daily rates quoted 56 54 78
10th Percentile £154 £263 £187
25th Percentile £220 £378 £263
Median daily rate (50th Percentile) £500 £473 £413
Median % change year-on-year +5.82% +14.48% -2.88%
75th Percentile £600 £538 £595
90th Percentile £631 £638 £655
England median daily rate £440 £450 £450
% change year-on-year -2.22% - -
Number of hourly rates quoted 3 9 8
10th Percentile - £27.20 £22.26
25th Percentile - - £25.28
Median hourly rate £32.05 £30.00 £27.25
Median % change year-on-year +6.83% +10.09% +45.61%
75th Percentile £32.41 £64.73 £47.88
90th Percentile £32.63 £67.28 £63.31
England median hourly rate £33.33 £30.41 £22.53
% change year-on-year +9.58% +34.99% +11.26%

All Application Platform Skills
South East

SharePoint falls under the Application Platforms category. For comparison with the information above, the following table provides summary statistics for all contract job vacancies requiring application platform skills in the South East.

Contract vacancies with a requirement for application platform skills 348 386 578
As % of all contract IT jobs advertised in the South East 10.08% 8.46% 10.28%
Number of daily rates quoted 211 245 384
10th Percentile £206 £258 £213
25th Percentile £357 £363 £330
Median daily rate (50th Percentile) £500 £450 £464
Median % change year-on-year +11.11% -2.96% -2.37%
75th Percentile £600 £565 £588
90th Percentile £650 £638 £677
England median daily rate £500 £525 £520
% change year-on-year -4.76% +0.96% -0.95%
Number of hourly rates quoted 12 26 38
10th Percentile £13.25 £25.06 £25.09
25th Percentile £22.63 £30.10 £51.56
Median hourly rate £32.41 £65.09 £58.05
Median % change year-on-year -50.20% +12.13% +190.23%
75th Percentile £59.06 £70.00 £69.06
90th Percentile £70.73 - £75.33
England median hourly rate £37.50 £47.50 £45.50
% change year-on-year -21.05% +4.40% +111.63%

SharePoint
Job Vacancy Trend in the South East

Job postings citing SharePoint as a proportion of all IT jobs advertised in the South East.
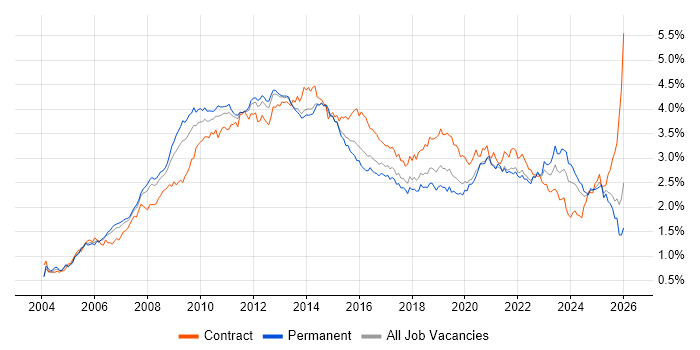
Job vacancy trend for SharePoint in the South East

SharePoint
Daily Rate Trend in the South East

Contractor daily rate distribution trend for jobs in the South East citing SharePoint.

Contractor daily rate distribution trend for jobs in the South East citing SharePoint

SharePoint
Daily Rate Histogram in the South East

Daily rate distribution for jobs citing SharePoint in the South East over the 6 months to 21 September 2025.

Daily rate histogram for SharePoint in the South East

SharePoint
Hourly Rate Trend in the South East

Contractor hourly rate distribution trend for jobs in the South East citing SharePoint.

Contractor hourly rate distribution trend for jobs in the South East citing SharePoint

SharePoint
Contract Job Locations in the South East

The table below looks at the demand and provides a guide to the median contractor rates quoted in IT jobs citing SharePoint within the South East region over the 6 months to 21 September 2025. The 'Rank Change' column provides an indication of the change in demand within each location based on the same 6 month period last year.

Location Rank Change
on Same Period
Last Year
Matching
Contract
IT Job Ads
Median
Daily Rate
Past 6 Months
Median Daily Rate
% Change
on Same Period
Last Year
Live
Jobs
Thames Valley +19 45 £509 +7.05% 46
Berkshire +28 37 £525 +16.67% 25
Hampshire +24 22 £600 - 30
Kent +9 10 £188 -42.31% 14
West Sussex +2 9 £173 -41.53% 5
Surrey +2 7 £500 +21.21% 16
Buckinghamshire -2 5 £463 -3.14% 16
Oxfordshire - 3 £450 - 7
Home Counties - 1 - -
SharePoint
England

SharePoint
Co-occurring Skills and Capabilities in the South East by Category

The follow tables expand on the table above by listing co-occurrences grouped by category. The same employment type, locality and period is covered with up to 20 co-occurrences shown in each of the following categories:

Application Platforms
1 21 (23.86%) Microsoft Exchange
2 15 (17.05%) SharePoint Server
3 14 (15.91%) Exchange Server 2010
4 13 (14.77%) Exchange Server 2003
4 13 (14.77%) Exchange Server 2007
4 13 (14.77%) Exchange Server 2013
4 13 (14.77%) Office Communications Server
4 13 (14.77%) Skype for Business
5 5 (5.68%) CMS
6 4 (4.55%) Confluence
7 1 (1.14%) SAS
Applications
1 24 (27.27%) Microsoft Office
2 22 (25.00%) Microsoft Excel
3 8 (9.09%) Microsoft PowerPoint
4 2 (2.27%) Microsoft Project
4 2 (2.27%) Windchill
5 1 (1.14%) Adobe Creative Suite
5 1 (1.14%) MS Visio
Business Applications
1 3 (3.41%) Dynamics CRM
2 1 (1.14%) CA PPM
Cloud Services
1 33 (37.50%) Microsoft 365
2 22 (25.00%) Power Platform
3 20 (22.73%) Azure
4 8 (9.09%) Azure DevOps
5 7 (7.95%) Dynamics 365
5 7 (7.95%) OneDrive
5 7 (7.95%) SaaS
6 6 (6.82%) Entra ID
7 5 (5.68%) Miro
8 4 (4.55%) Microsoft Copilot
9 3 (3.41%) PowerApps
10 2 (2.27%) AWS
11 1 (1.14%) Cloud Computing
11 1 (1.14%) Copilot Studio
11 1 (1.14%) IaaS
11 1 (1.14%) Power Automate
11 1 (1.14%) ShareGate
11 1 (1.14%) SuccessFactors
11 1 (1.14%) Veeva
Communications & Networking
1 21 (23.86%) DNS
2 19 (21.59%) VPN
3 15 (17.05%) DHCP
4 14 (15.91%) SAN
5 13 (14.77%) DDNS
6 8 (9.09%) Firewall
6 8 (9.09%) TCP/IP
7 5 (5.68%) Remote Desktop
8 2 (2.27%) Internet
9 1 (1.14%) Intranet
9 1 (1.14%) Intrusion Detection
9 1 (1.14%) IP Telephony
9 1 (1.14%) MPLS
9 1 (1.14%) NAS
9 1 (1.14%) NetScaler
9 1 (1.14%) Network Security
9 1 (1.14%) SD-WAN
9 1 (1.14%) Unified Communications
9 1 (1.14%) Wi-Fi
9 1 (1.14%) Wireless
Database & Business Intelligence
1 18 (20.45%) Power BI
2 5 (5.68%) Crystal Reports
3 3 (3.41%) BusinessObjects Business Intelligence
4 2 (2.27%) Metadata
5 1 (1.14%) Microsoft Analysis Services
5 1 (1.14%) Power Query
5 1 (1.14%) Relational Database
5 1 (1.14%) Sisense
5 1 (1.14%) SQL Server
5 1 (1.14%) SQL Server Analysis Services
5 1 (1.14%) SQL Server Reporting Services
5 1 (1.14%) Tableau
Development Applications
1 5 (5.68%) JIRA
General
1 23 (26.14%) Social Skills
2 15 (17.05%) Finance
3 14 (15.91%) Analytical Skills
4 8 (9.09%) Public Sector
4 8 (9.09%) Telecoms
5 7 (7.95%) Organisational Skills
6 6 (6.82%) Inclusion and Diversity
7 5 (5.68%) Law
7 5 (5.68%) Legal
8 3 (3.41%) Documentation Skills
8 3 (3.41%) Manufacturing
9 2 (2.27%) Automotive
9 2 (2.27%) Publishing
9 2 (2.27%) Retail
10 1 (1.14%) Billing
10 1 (1.14%) French Language
10 1 (1.14%) Italian Language
10 1 (1.14%) Local Government
10 1 (1.14%) Presentation Skills
10 1 (1.14%) Spanish Language
Job Titles
1 17 (19.32%) Support Engineer
2 15 (17.05%) Analyst
3 13 (14.77%) Exchange Engineer
3 13 (14.77%) Exchange Support
4 10 (11.36%) IT Support
5 7 (7.95%) Support Analyst
5 7 (7.95%) Support Officer
6 6 (6.82%) 3rd Line Engineer
6 6 (6.82%) Junior
7 5 (5.68%) 3rd Line Support
7 5 (5.68%) 3rd Line Support Engineer
7 5 (5.68%) Data Analyst
7 5 (5.68%) Help Desk Officer
7 5 (5.68%) Help Desk Support
7 5 (5.68%) Junior Analyst
7 5 (5.68%) Junior Support Analyst
7 5 (5.68%) Portfolio Analyst
7 5 (5.68%) Project Manager
7 5 (5.68%) Service Desk Officer
7 5 (5.68%) Service Desk Support
Libraries, Frameworks & Software Standards
1 3 (3.41%) CSS
2 2 (2.27%) ADO
2 2 (2.27%) HTML
2 2 (2.27%) SPFx
3 1 (1.14%) .NET
3 1 (1.14%) .NET Framework
3 1 (1.14%) jQuery
3 1 (1.14%) Kendo UI
3 1 (1.14%) MDX
3 1 (1.14%) Software Packaging
3 1 (1.14%) Web Services
Miscellaneous
1 13 (14.77%) Replication
2 7 (7.95%) Onboarding
3 4 (4.55%) Life Science
4 3 (3.41%) Management Information System
4 3 (3.41%) Mobile App
4 3 (3.41%) Renewable Energy
4 3 (3.41%) Self-Motivation
5 2 (2.27%) Analytical Mindset
5 2 (2.27%) Data Protection Act
5 2 (2.27%) Learning Management System
6 1 (1.14%) Cyber Defence
6 1 (1.14%) Hybrid Cloud
6 1 (1.14%) Video Conferencing
6 1 (1.14%) Wiki
Operating Systems
1 29 (32.95%) Windows
2 13 (14.77%) Windows Server 2003
3 7 (7.95%) Windows Server
4 5 (5.68%) Windows 10
4 5 (5.68%) Windows Server 2012
4 5 (5.68%) Windows Server 2016
5 1 (1.14%) Mac OS
5 1 (1.14%) Windows 7
Processes & Methodologies
1 27 (30.68%) Business Intelligence
2 22 (25.00%) ITIL
3 19 (21.59%) Problem-Solving
4 18 (20.45%) PRINCE2
5 17 (19.32%) CRM
6 15 (17.05%) Content Management
6 15 (17.05%) Project Management
7 13 (14.77%) Architectural Design
7 13 (14.77%) Enterprise Content Management
7 13 (14.77%) Enterprise Search
7 13 (14.77%) High Availability
8 12 (13.64%) Agile
9 11 (12.50%) Continuous Improvement
10 10 (11.36%) Migration
10 10 (11.36%) Portfolio Management
11 8 (9.09%) Change Control
11 8 (9.09%) Collaborative Working
11 8 (9.09%) Decision-Making
11 8 (9.09%) DevOps
12 7 (7.95%) Actionable Insight
Programming Languages
1 7 (7.95%) SQL
2 3 (3.41%) JavaScript
2 3 (3.41%) PowerShell
3 2 (2.27%) C#
Qualifications
1 18 (20.45%) Security Cleared
2 13 (14.77%) DV Cleared
3 9 (10.23%) Degree
4 5 (5.68%) APMP
5 4 (4.55%) SC Cleared
6 2 (2.27%) Computer Science Degree
6 2 (2.27%) Microsoft Certification
6 2 (2.27%) PMI Certification
6 2 (2.27%) PMP
7 1 (1.14%) A+ Certification
7 1 (1.14%) MCP
Quality Assurance & Compliance
1 7 (7.95%) QA
2 5 (5.68%) GDPR
2 5 (5.68%) P3O
3 4 (4.55%) PMO
4 3 (3.41%) Cyber Essentials
5 2 (2.27%) Data Quality
5 2 (2.27%) ISO 9001
5 2 (2.27%) ISO/IEC 27001
5 2 (2.27%) SOC 2
6 1 (1.14%) Cyber Essentials PLUS
6 1 (1.14%) GxP
6 1 (1.14%) PCI DSS
System Software
1 29 (32.95%) Active Directory
2 13 (14.77%) Brightmail
2 13 (14.77%) ISA Server
3 6 (6.82%) Hyper-V
3 6 (6.82%) VMware Infrastructure
4 5 (5.68%) Terminal Services
5 1 (1.14%) vSphere
5 1 (1.14%) XenApp
Systems Management
1 13 (14.77%) Microsoft Clustering
2 7 (7.95%) Microsoft Intune
3 3 (3.41%) SCCM
4 1 (1.14%) Active Directory Federation Services
4 1 (1.14%) Jamf Pro
Vendors
1 52 (59.09%) Microsoft
2 10 (11.36%) IFS
3 7 (7.95%) Citrix
3 7 (7.95%) VMware
4 6 (6.82%) Oracle
5 4 (4.55%) SAP
6 2 (2.27%) Cisco
6 2 (2.27%) Salesforce
7 1 (1.14%) Adobe
7 1 (1.14%) Apple
7 1 (1.14%) F5
7 1 (1.14%) Meraki
7 1 (1.14%) Micro Focus
7 1 (1.14%) MicroStrategy
7 1 (1.14%) Nintex
7 1 (1.14%) Virgin Media