Computer Science Jobs in London

Computer Science
England > London

The following table provides summary statistics for permanent job vacancies advertised in London with a requirement for Computer Science skills. Included is a benchmarking guide to the salaries offered in vacancies that have cited Computer Science over the 6 months to 1 December 2023 with a comparison to the same period in the previous 2 years.

6 months to
1 Dec 2023
Same period 2022 Same period 2021
Rank 33 50 45
Rank change year-on-year +17 -5 +4
Permanent jobs citing Computer Science 1,257 2,960 3,726
As % of all permanent jobs advertised in London 6.72% 6.18% 7.20%
As % of the Processes & Methodologies category 7.18% 6.45% 7.49%
Number of salaries quoted 933 1,388 1,844
10th Percentile £50,000 £41,635 £41,250
25th Percentile £62,275 £55,000 £52,500
Median annual salary (50th Percentile) £85,000 £75,000 £73,388
Median % change year-on-year +13.33% +2.20% +4.84%
75th Percentile £110,000 £100,313 £95,000
90th Percentile £150,000 £120,000 £110,000
England median annual salary £65,000 £62,500 £60,000
% change year-on-year +4.00% +4.17% -

All Process and Methodology Skills
London

Computer Science is in the Processes and Methodologies category. The following table is for comparison with the above and provides summary statistics for all permanent job vacancies advertised in London with a requirement for process or methodology skills.

Permanent vacancies with a requirement for process or methodology skills 17,505 45,859 49,743
As % of all permanent jobs advertised in London 93.56% 95.77% 96.15%
Number of salaries quoted 14,030 31,132 33,332
10th Percentile £42,000 £42,500 £42,250
25th Percentile £56,250 £55,000 £53,000
Median annual salary (50th Percentile) £75,000 £72,500 £70,000
Median % change year-on-year +3.45% +3.57% -
75th Percentile £95,000 £93,750 £90,000
90th Percentile £116,250 £112,500 £108,750
England median annual salary £60,000 £62,500 £60,000
% change year-on-year -4.00% +4.17% +9.09%

Computer Science
Job Vacancy Trend in London

Job postings citing Computer Science as a proportion of all IT jobs advertised in London.
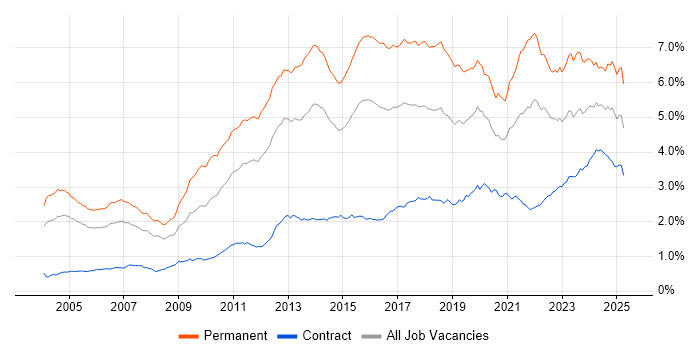
Job vacancy trend for Computer Science in London

Computer Science
Salary Trend in London

3-month moving average salary quoted in jobs citing Computer Science in London.

Salary trend for Computer Science in London

Computer Science
Salary Histogram in London

Salary distribution for jobs citing Computer Science in London over the 6 months to 1 December 2023.

Salary histogram for Computer Science in London

Computer Science
Job Locations in London

The table below looks at the demand and provides a guide to the median salaries quoted in IT jobs citing Computer Science within the London region over the 6 months to 1 December 2023. The 'Rank Change' column provides an indication of the change in demand within each location based on the same 6 month period last year.

Location Rank Change
on Same Period
Last Year
Matching
Permanent
IT Job Ads
Median Salary
Past 6 Months
Median Salary
% Change
on Same Period
Last Year
Live
Jobs
Central London +35 196 £85,000 +6.25% 60
West London +8 16 £82,500 +17.86% 37
South London +21 10 £60,000 -0.50% 4
North London +2 7 £66,250 +10.42% 4
East London -30 2 £27,500 -63.33% 145
Computer Science
England

Computer Science
Co-occurring Skills and Capabilities in London by Category

The follow tables expand on the table above by listing co-occurrences grouped by category. The same employment type, locality and period is covered with up to 20 co-occurrences shown in each of the following categories:

Application Platforms
1 90 (7.16%) MS Exchange
2 27 (2.15%) Apache Spark
3 26 (2.07%) Apache Airflow
4 18 (1.43%) SharePoint
5 15 (1.19%) Apache
6 10 (0.80%) Confluence
7 9 (0.72%) Anypoint
8 8 (0.64%) CMS
8 8 (0.64%) Jupyter
8 8 (0.64%) WordPress
9 6 (0.48%) SAS
10 5 (0.40%) Luigi
11 4 (0.32%) OpenEdge
12 3 (0.24%) Adobe Experience Manager
12 3 (0.24%) IIS
13 2 (0.16%) Apache Pig
13 2 (0.16%) Drupal
13 2 (0.16%) JBoss
13 2 (0.16%) nginx
13 2 (0.16%) NServiceBus
Applications
1 35 (2.78%) Microsoft Excel
2 25 (1.99%) Microsoft Office
3 15 (1.19%) Microsoft Project
4 8 (0.64%) Adobe Creative Suite
5 3 (0.24%) 3ds Max
5 3 (0.24%) Blender
5 3 (0.24%) Maya
5 3 (0.24%) Sketch
6 2 (0.16%) Microsoft PowerPoint
6 2 (0.16%) MS Visio
6 2 (0.16%) UXPin
6 2 (0.16%) Zeplin
7 1 (0.080%) InVision
7 1 (0.080%) SPSS
7 1 (0.080%) Trello
Business Applications
1 12 (0.95%) NetSuite
2 3 (0.24%) SAP ERP
3 2 (0.16%) SAP S/4HANA
4 1 (0.080%) Alphatax
4 1 (0.080%) Distributed Ledger
4 1 (0.080%) Dynamics CRM
4 1 (0.080%) Endur
4 1 (0.080%) JDE EnterpriseOne
4 1 (0.080%) Oracle Procure-to-Pay
4 1 (0.080%) R3 Corda
4 1 (0.080%) Temenos T24
Cloud Services
1 293 (23.31%) AWS
2 274 (21.80%) Azure
3 142 (11.30%) Microsoft 365
4 93 (7.40%) GCP
5 63 (5.01%) SaaS
6 48 (3.82%) Power Platform
7 47 (3.74%) Serverless
8 43 (3.42%) Azure DevOps
9 39 (3.10%) PaaS
10 38 (3.02%) IaaS
11 36 (2.86%) Cloud Computing
12 22 (1.75%) GitHub
13 21 (1.67%) Entra ID
13 21 (1.67%) Figma
14 17 (1.35%) Azure Cosmos DB
14 17 (1.35%) Azure Monitor
14 17 (1.35%) Datadog
15 15 (1.19%) AWS Lambda
16 14 (1.11%) Amazon S3
17 13 (1.03%) Amazon EMR
Communications & Networking
1 105 (8.35%) WAN
2 104 (8.27%) WebEx
3 99 (7.88%) Wireless
4 98 (7.80%) SD-WAN
5 93 (7.40%) Cisco IOS
6 48 (3.82%) Firewall
7 30 (2.39%) Network Security
8 25 (1.99%) VPN
9 22 (1.75%) Wi-Fi
10 20 (1.59%) DNS
10 20 (1.59%) Internet
11 19 (1.51%) TCP/IP
12 18 (1.43%) DHCP
12 18 (1.43%) VoIP
13 17 (1.35%) Intrusion Detection
14 16 (1.27%) Unified Communications
15 12 (0.95%) H.323
16 11 (0.88%) LAN
16 11 (0.88%) VLAN
17 10 (0.80%) SAN
Database & Business Intelligence
1 61 (4.85%) SQL Server
2 58 (4.61%) Data Warehouse
3 43 (3.42%) Power BI
4 41 (3.26%) Data Lake
5 37 (2.94%) Big Data
6 35 (2.78%) NoSQL
7 29 (2.31%) Relational Database
7 29 (2.31%) Tableau
8 27 (2.15%) Hadoop
9 26 (2.07%) Amazon Redshift
10 23 (1.83%) MySQL
11 22 (1.75%) MongoDB
11 22 (1.75%) PostgreSQL
12 18 (1.43%) KDB
13 17 (1.35%) Redis
14 16 (1.27%) Apache Hive
14 16 (1.27%) SQL Server Integration Services
15 14 (1.11%) Looker
16 12 (0.95%) Elasticsearch
17 11 (0.88%) Amazon RDS
Development Applications
1 76 (6.05%) Git
2 49 (3.90%) Jenkins
3 32 (2.55%) JIRA
4 22 (1.75%) GitLab
5 17 (1.35%) Maven
6 14 (1.11%) Postman
7 10 (0.80%) Selenium
8 8 (0.64%) Artifactory
9 7 (0.56%) Cucumber
9 7 (0.56%) Sonatype Nexus
9 7 (0.56%) Xcode
10 6 (0.48%) git-flow
10 6 (0.48%) RStudio
10 6 (0.48%) Visual Studio Code
11 5 (0.40%) Serilog
11 5 (0.40%) SoapUI
11 5 (0.40%) SonarQube
11 5 (0.40%) SpecFlow
12 4 (0.32%) Gradle
12 4 (0.32%) TeamCity
General
1 578 (45.98%) Social Skills
2 328 (26.09%) Finance
3 207 (16.47%) Analytical Skills
4 67 (5.33%) Banking
5 60 (4.77%) Front Office
5 60 (4.77%) Marketing
5 60 (4.77%) Telecoms
6 53 (4.22%) Legal
7 44 (3.50%) Public Sector
8 43 (3.42%) Financial Institution
9 38 (3.02%) Retail
10 34 (2.70%) Presentation Skills
11 31 (2.47%) Games
12 30 (2.39%) Inclusion and Diversity
13 27 (2.15%) Investment Banking
13 27 (2.15%) Manufacturing
14 25 (1.99%) Electronics
15 22 (1.75%) Back Office
16 20 (1.59%) Law
17 18 (1.43%) Influencing Skills
Job Titles
1 339 (26.97%) Developer
2 221 (17.58%) Senior
3 131 (10.42%) Lead
4 117 (9.31%) Analyst
5 108 (8.59%) Architect
6 107 (8.51%) Java Developer
7 95 (7.56%) IT Support
8 92 (7.32%) Support Specialist
9 91 (7.24%) IT Support Specialist
10 89 (7.08%) Software Engineer
11 57 (4.53%) Data Engineer
12 53 (4.22%) Senior Developer
13 51 (4.06%) Solutions Architect
14 42 (3.34%) Junior
15 37 (2.94%) Software Developer
16 36 (2.86%) DevOps Engineer
17 33 (2.63%) Project Manager
18 31 (2.47%) Lead Software Engineer
19 30 (2.39%) Python Developer
19 30 (2.39%) Senior Manager
Libraries, Frameworks & Software Standards
1 89 (7.08%) .NET
2 74 (5.89%) RESTful
3 72 (5.73%) CSS
4 70 (5.57%) HTML
5 55 (4.38%) React
6 47 (3.74%) JSON
7 37 (2.94%) .NET Framework
8 36 (2.86%) AngularJS
8 36 (2.86%) Spring
9 32 (2.55%) Kafka
10 29 (2.31%) Spring Boot
11 25 (1.99%) Web Services
12 24 (1.91%) REST
13 23 (1.83%) ASP.NET
14 21 (1.67%) Node.js
15 19 (1.51%) XML
16 18 (1.43%) .NET Core
17 17 (1.35%) Pandas
17 17 (1.35%) PySpark
18 15 (1.19%) Flask
Miscellaneous
1 110 (8.75%) Greenfield Project
2 92 (7.32%) Video Conferencing
2 92 (7.32%) Wiki
3 88 (7.00%) Algorithms
4 74 (5.89%) Management Information System
5 64 (5.09%) Hedge funds
6 62 (4.93%) Foreign Exchange (FX)
7 52 (4.14%) Data Structures
8 49 (3.90%) Fixed Income
9 47 (3.74%) Self-Motivation
10 45 (3.58%) Distributed Systems
11 38 (3.02%) Equities
12 30 (2.39%) Mobile App
13 27 (2.15%) Onboarding
13 27 (2.15%) Virtual Team
14 22 (1.75%) Product Ownership
15 18 (1.43%) Cloud Native
15 18 (1.43%) Security Posture
16 17 (1.35%) Blockchain
17 16 (1.27%) Public Cloud
Operating Systems
1 197 (15.67%) Windows
2 124 (9.86%) Windows 10
3 109 (8.67%) Android
4 104 (8.27%) Linux
5 35 (2.78%) Windows Server
6 25 (1.99%) Unix
7 18 (1.43%) Apple iOS
7 18 (1.43%) Windows Server 2016
8 13 (1.03%) Mac OS X
9 12 (0.95%) Windows Server 2019
10 11 (0.88%) Mac OS
11 6 (0.48%) Windows Server 2012
12 5 (0.40%) VMS
13 3 (0.24%) FreeRTOS
14 2 (0.16%) Debian
15 1 (0.080%) Oracle Linux
15 1 (0.080%) Ubuntu
Processes & Methodologies
1 383 (30.47%) Problem-Solving
2 254 (20.21%) Agile
3 234 (18.62%) Software Engineering
4 211 (16.79%) Mathematics
5 174 (13.84%) DevOps
6 154 (12.25%) Fintech
7 150 (11.93%) Analytics
8 135 (10.74%) Data Science
9 123 (9.79%) Microservices
10 114 (9.07%) CI/CD
11 110 (8.75%) Cybersecurity
11 110 (8.75%) Mentoring
12 104 (8.27%) Low Latency
13 101 (8.04%) SDLC
14 97 (7.72%) Business Continuity
15 95 (7.56%) BCP
15 95 (7.56%) Contract Negotiation
15 95 (7.56%) Mobile Device Management
16 91 (7.24%) Business Continuity Planning
17 90 (7.16%) Machine Learning
Programming Languages
1 348 (27.68%) Python
2 270 (21.48%) SQL
3 264 (21.00%) Java
4 193 (15.35%) C#
5 165 (13.13%) C++
6 131 (10.42%) JavaScript
7 65 (5.17%) PowerShell
8 52 (4.14%) Bash
9 39 (3.10%) TypeScript
10 34 (2.70%) R
11 27 (2.15%) Go
12 24 (1.91%) Scala
13 19 (1.51%) PHP
14 18 (1.43%) C
15 17 (1.35%) Kotlin
16 14 (1.11%) Rust
17 13 (1.03%) MATLAB
17 13 (1.03%) Ruby
18 12 (0.95%) Shell Script
19 10 (0.80%) T-SQL
Qualifications
1 1,113 (88.54%) Degree
2 751 (59.75%) Computer Science Degree
3 339 (26.97%) Master's Degree
4 81 (6.44%) PhD
5 56 (4.46%) Azure Certification
6 50 (3.98%) CISSP
7 34 (2.70%) AWS Certification
8 32 (2.55%) Microsoft Certification
8 32 (2.55%) Security Cleared
9 28 (2.23%) SC Cleared
10 26 (2.07%) Cisco Certification
11 25 (1.99%) CISM
12 20 (1.59%) PMI Certification
13 19 (1.51%) PMP
14 18 (1.43%) CEH
15 16 (1.27%) TOGAF Certification
16 14 (1.11%) AWS Certified Solutions Architect
17 12 (0.95%) (ISC)2 CCSP
17 12 (0.95%) GSEC
18 10 (0.80%) CCSP
Quality Assurance & Compliance
1 79 (6.28%) QA
2 42 (3.34%) ISO/IEC 27001
2 42 (3.34%) NIST
3 38 (3.02%) Data Quality
4 20 (1.59%) PCI DSS
5 19 (1.51%) GDPR
6 13 (1.03%) NCSC
7 9 (0.72%) Cyber Essentials
8 7 (0.56%) SOC 2
9 6 (0.48%) Accessibility
9 6 (0.48%) SLA
10 4 (0.32%) Cyber Essentials PLUS
11 2 (0.16%) Actionable Recommendations
11 2 (0.16%) COBIT
11 2 (0.16%) SNOMED CT
12 1 (0.080%) GAMP
12 1 (0.080%) HIPAA
12 1 (0.080%) IFRS
12 1 (0.080%) IFRS 9
12 1 (0.080%) ISO 8583
System Software
1 140 (11.14%) Active Directory
2 116 (9.23%) Docker
3 93 (7.40%) VMware ESXi
4 90 (7.16%) Microsoft App-V
4 90 (7.16%) XenApp
4 90 (7.16%) XenDesktop
5 28 (2.23%) VMware Infrastructure
6 16 (1.27%) Hyper-V
7 7 (0.56%) Firmware
8 4 (0.32%) Virtual Machines
9 3 (0.24%) BitLocker
10 2 (0.16%) HDFS
10 2 (0.16%) Virtual Servers
10 2 (0.16%) vSphere
11 1 (0.080%) KVM
11 1 (0.080%) NFS
Systems Management
1 100 (7.96%) SCCM
2 93 (7.40%) Kubernetes
3 79 (6.28%) AirWatch
4 65 (5.17%) Terraform
5 28 (2.23%) Ansible
6 14 (1.11%) Microsoft Intune
7 13 (1.03%) Cisco CUCM
8 12 (0.95%) Argo
8 12 (0.95%) Cisco Prime
8 12 (0.95%) Cisco UCCX
9 8 (0.64%) Single Sign-On
10 7 (0.56%) Packer
11 5 (0.40%) Grafana
12 4 (0.32%) WSUS
13 2 (0.16%) CASB
13 2 (0.16%) DatAdvantage
13 2 (0.16%) MIIS
13 2 (0.16%) Prometheus
13 2 (0.16%) Puppet
13 2 (0.16%) QRadar
Vendors
1 288 (22.91%) Microsoft
2 124 (9.86%) Cisco
3 95 (7.56%) Citrix
4 59 (4.69%) Google
5 37 (2.94%) VMware
6 31 (2.47%) SAP
7 25 (1.99%) Oracle
8 21 (1.67%) Salesforce
9 17 (1.35%) Splunk
10 16 (1.27%) Apple
10 16 (1.27%) Databricks
11 15 (1.19%) Bloomberg
12 14 (1.11%) Adobe
12 14 (1.11%) MuleSoft
13 12 (0.95%) LogicMonitor
14 11 (0.88%) Alteryx
14 11 (0.88%) Okta
15 10 (0.80%) Dynatrace
16 9 (0.72%) F5
17 8 (0.64%) AppDynamics